New Wallets on Etheruem - A Closer Look
New Wallets on Ethereum
Estimating user adoption is hard.
-
Often, the cumulative number of new wallet addresses performing transactions are often used as a proxy to gauge adoption and user growth.
-
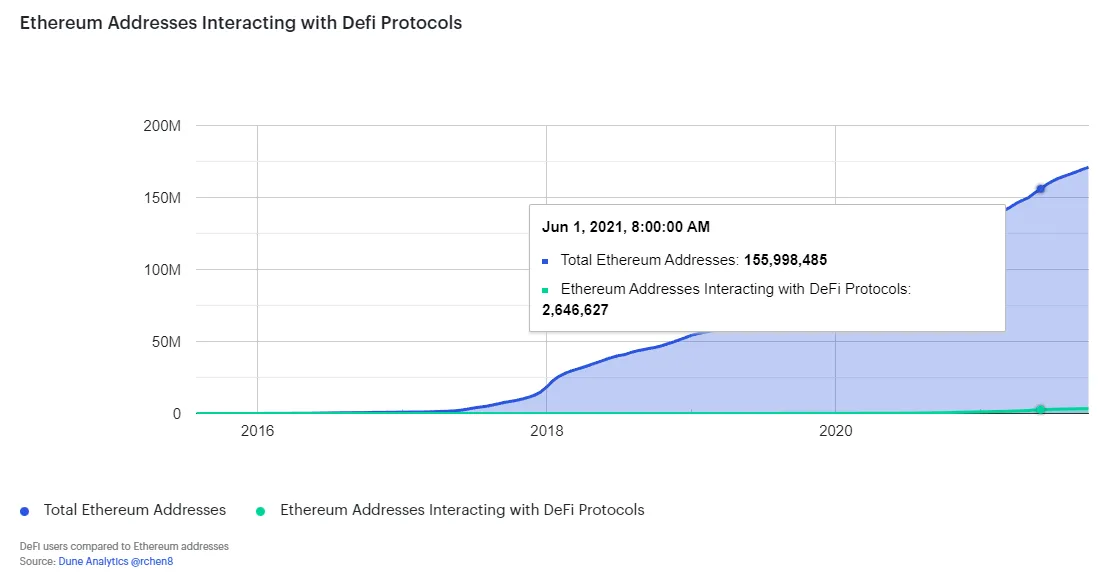
Reports and DeFi frequently cite wallet addresses comparing ecosystem system activity (left)
-
This conflates the number of true users in the ecosystem, giving the illusion of high adoption
-
Existing metrics don’t highlight how active users were and when were they last active
\
Key Findings
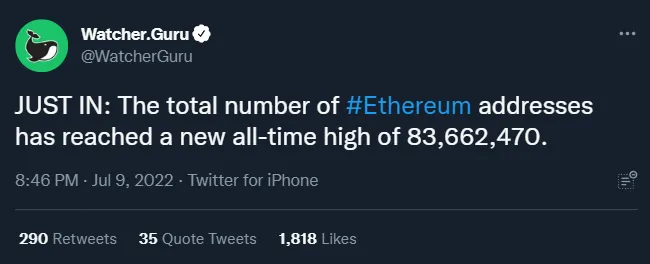
In this dashboard, I show that only a small fraction 500k+ (~0.4%) of the 139M+ wallets created since 2019 were truly active.
Image:
Tweet:
Approach
ethereum.core.fact_traceswas used for this analysis: this table contains flattened trace data for internal contract calls on the Ethereum blockchain- The number of addresses
from_addressperforming their first transaction were counted and summed cumulatively over time. Smart contract addresses were excluded from this count, wallets with > 10k tx performed were also excluded (as bots). - True Active users were defined as those who have performed transactions for more than a month (28 separate days) and have performed transactions in the last month (last tx in < 28 days ago). The cumulative number of users and active users were then added across time
By Accounting for Days Active
In this chart, the new wallets are counted by the distinct number of days where they have been active (i.e. days active). Users who performed transactions on 30 separate days (which doesn't have to be consecutive) were defined to be active for a month.
We see a huge difference in the new wallet count across different filters.
By Crude Wallets
The chart on the right shows the number of new wallets initiating their first transaction and the cumulative total number of wallets from 2019. Smart contracts were excluded from this analysis.
Most analyses stop here, we don’t know how many of these users transacted only once, and are still currently active on Ethereum.
This creates this false illusion of high adoption. It does not address how many of the 138M++ wallets are active,
Defining True Active Users*
Here, we add another condition in counting new wallet addresses - those that are active for at least a month (performed tx on 28 days or more) and were active in the last month (last tx in less than 28 days).
While the permutation of days active / days last active can be adjusted depending on the analyst’s preference, this still shows that new addresses are not necessarily the best metrics to determine adoption. More work needs to be done in determining how we can filter linked wallets as well. This also implies the true, unique and distinct users who are active may be a lot lower.
Of the total 138M, only 573k+ were classified as active wallets.
The chart above shows the Total True Active Users vs Cumulative New Wallets
- Daily New True Active Users (in blue) tells us how many of the wallets created on that day were active for >1 month and active in the last month
- The majority of the true active users were those who onboarded in March 2021 to December 2021
- The New True Active users have been on a decline since 2022
At the time of analysis, ~ 1.9M+ wallets created since 2019 were active for a month.
- Of the 138M wallets, only 51M+ were active for 2 or more days.
- This also means that the remaining 80M++ wallets created were no longer used after transacting for a day.
From 2019, we identified a total of 138.7m+ wallets.
- \
- Another observation is that the number of new wallets has been on the decline since 2021 Summer