Hop In the Pool
Analyze how users join pools on Osmosis. Do they dive in headfirst (add both assets; joinpool) or do they wade in carefully (singleside; join swap extern amount in). Also analyze how deep the pool is (typical swap size in token and USD for both activities).
Introduction
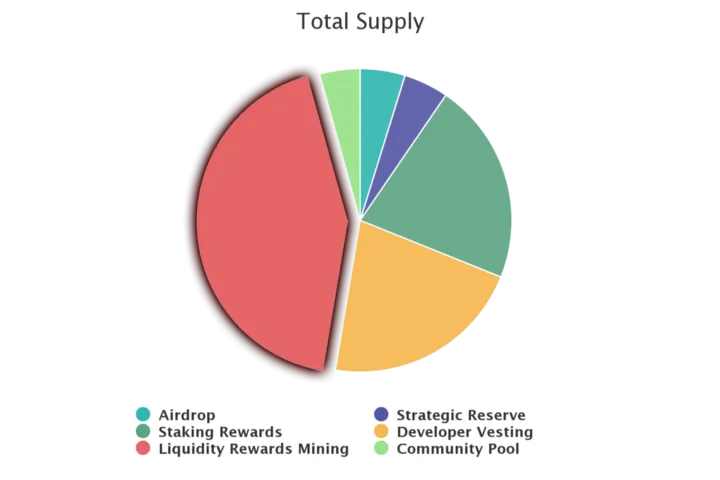
Osmosis is an automated market maker (AMM) protocol built for liquidity providers. Therefore, it should be governed and owned by liquidity providers. Over time, the largest allocation of OSMO tokens is set aside for liquidity incentives to reward liquidity providers for their contributions and give them an ownership stake in the future of the protocol.
The process for earning these liquidity incentives is known as liquidity mining. While many within the Cosmos ecosystem are familiar with concepts like staking rewards and community pools, Osmosis is the first Cosmos project to introduce liquidity incentives.
Osmosis aims to be the most innovative AMM across all ecosystems. Osmosis has many planned features in development to improve LP incentives beyond what current AMMs have been able to accomplish.

Liquidity Providing
Providing liquidity (called “LPing”) is the process of depositing assets into an AMM pool. AMMs are decentralized finance protocols that allow for the swapping of assets without a centralized intermediary. Just as trading firms make traditional markets, AMMs establish prices and facilitate trades using permissionless liquidity pools into which users can deposit assets.
For example, if Pool #1 is the OSMO<>ATOM pool, users can deposit OSMO and ATOM tokens into the pool and receive back Pool1 share tokens. These Pool1 share tokens (called LP tokens) represent one’s proportional ownership of the pool.
Add both assets:
Liquidity pools have specific ratios at which assets must be deposited. Most AMMs require that assets be added at a 50–50 ratio (the total value of Asset 1 is equal to the total value of Asset 2).
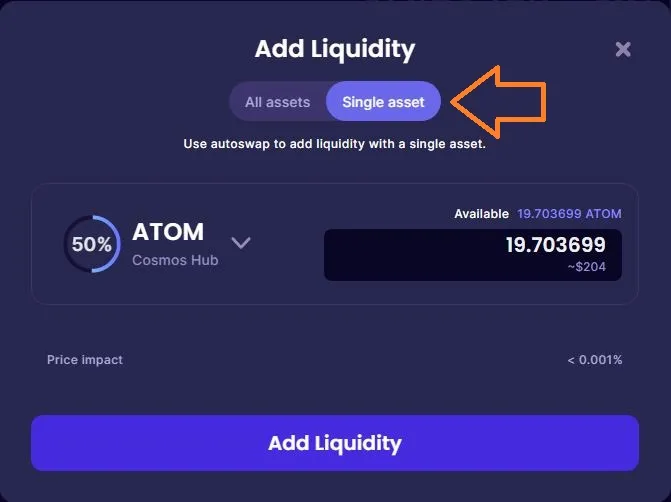
Single Asset LP
This feature was added to Osmosis on December 17, 2021. The Single Asset LP feature is a convenience option that essentially converts your tokens to the correct pool weight, then adds them to the pool in one transaction. Swap fees will apply, and the pool ratio will be affected by the swap. Since the tokens were already swapped, when you remove liquidity you’ll receive equivalent amounts of each pooled token in proportion to the pool weight.
This new Single Asset LP feature takes advantage of the Join Swap Extern Amount In transaction, which was present in Osmosis since launch, though not accessible through the UI until now. It allows you to add liquidity to a pool without swapping to the appropriate pool weight first (while most pools currently on Osmosis are dual asset pools weighted 50–50, the protocol supports multiple asset pools and custom pool weights). This transaction will first swap the tokens to the correct weight, so a swap fee will be assessed, proportional to the tokens that would need to be swapped for a regular pool add.
Regardless of the method you use to add liquidity, when you decide to remove liquidity, you’ll receive back an equivalent amount of each of the pooled tokens, in proportion to the pool weight.
Read more about this feature on here.
Method
In this dashboard I will be using osmosis.core database to analyze how users are adding liquidity to pools and find out how users are joining to pool on Osmosis. Base on the above definitions I have decided to breakdown add liquidity transactions (that can be filtered by this condition: where action = 'pool_joined' ) and then select TX_IDs with one record on fact_liquidity_provider_actions table as single asset transactions and TX_IDs with more than one record on fact_liquidity_provider_actions table as all assets transactions. The logic behind this idea is that when someone want to add liquidity in single asset mode then there will be one row with where action = 'pool_joined' condition on fact_liquidity_provider_actions table that represents this transaction. Also when someone want to add liquidity in normal way (all assets that considered as both assets in this dashboard) there will be more than one row with where action = 'pool_joined' condition on fact_liquidity_provider_actions table that represents this transaction.
In following charts and visualizations everywhere I have written both_assets means Headfirst dive in and everywhere I have written single_asset means carefully wade in or Singleside.
The last section of this dashboard is parameterized and you can type one pool_id to see the info about the selected pool. You can find all pool ids by search pool name here.
Overall Stats
The following charts show general info about liquidity actions on Osmosis.
The remarkable point on following charts is total USD volume of headfirst transactions is much higher than singleside transactions.
Overtime Analysis
On following charts we can see an increasing trend in number of add liquidity transactions after adding Single Asset LP feature on December, 2021 and these metrics were growing from that time to March, 2022.
Popular Pools
On following chart we can see the most popular pools on Osmosis in terms of number of join pool transactions by users. The X axis represents pool_id and the Y axis shows number of transactions for each pool.
Pool #1 (ATOM / OSMO) is the most popular pool in both headfirst and singleside types.
Most Active Users
The following charts show 10 user addresses with the most number of join pool transactions breakdown by LP type (headfirst and singleside).
Most Popular Assets
The following two charts show 10 most popular assets in term of number of join pool transactions.
Assets Overtime
The following charts show portion of each assets in number of join pool transactions per week. In other words each bar represents percent of assets that deposited to Osmosis pools in one week. The left chart is for headfirst dive in LPs and the right chart shows single assets LPs.
USD Volume Overtime
The following charts show deposited volume in USD to Osmosis poos breakdown by add liquidity type.
The deposited USD volume to pools in last 6 month was too low compare to before last 6 month.
Popular Pools By Deposited Volume
On following charts we can see the most popular pools on Osmosis in terms of deposited volume (USD) to pools by users. The X axis represents pool_id and the Y axis shows total deposited volume in USD for each pool.
Pool #1 (ATOM / OSMO) has the most deposited volume in both headfirst and singleside types.
Users With Most USD Volume
The following charts show 10 users that had most deposited amount in USD for both headfirst and singleside add liquidities.
Popular Assets By Volume
The following charts show 10 assets with the most deposited volume in USD by Osmosis users.
INJ and IOV are excluded from the result based on the explanation on this dashboard by Ali3N#8546.
Assets Volume Overtime
The following charts show portion of each assets in USD volume of join pool transactions per week. In other words each bar represents volume percent of assets that deposited to Osmosis pools in one week. The left chart is for headfirst dive in LPs and the right chart shows single assets LPs.
Parameterized Info
The following charts shows these four metrics for selected pool id:
- Deposited volume in USD per week breakdown by LP type
- Normalized volume in USD per week breakdown by LP type
- Number of add liquidity transactions per week breakdown by LP type
- Number of unique users have joined to pools per week breakdown by LP type
You can find Osmosis pool ids on
Conclusion
- The volume of add liquidity transaction in headfirst way is remarkably more than The volume of single asset LP.
- In average volume of headfirst liquidity actions is 4M USD per day while the same average for single asset LP is 0.9M USD.
- In term of number of add liquidity transactions ATOM/OSMO pool is the most popular and most used pool in both headfirst way and single asset way.
- ATOM/OSMO pool also has the most deposited volume in USD.
- OSMO is the most popular asset between users that joined to pools in term of number of add liquidity transactions.
- The deposited volume to pools in USD over last 6 month was too low compare to before last 6 month.
==Discord==: pouya_22#1482
Link to tweet: