$OSMO Recent Pumps
Introduction
In this dashboard, we want to check whether something happened in the network during the last three times, which were on 2022/01/10 -- 2022/01/24 -- 2022/01/03 when the price of $OSMO was pumped, or whether this pump was caused by the behaviour of whales or retail traders or other special news/events.
Tables listed below are used to create queries of this dashboard:
- ==osmosis.core.dim_prices==
- ==osmosis.core.fact_transactions==
- ==osmosis.core.fact_transfers==
- ==osmosis.core.fact_swaps==
- ==osmosis.core.dim_labels==
- ==osmosis.core.fact_staking==
- ==osmosis.core.fact_liquidity_provider_actions==
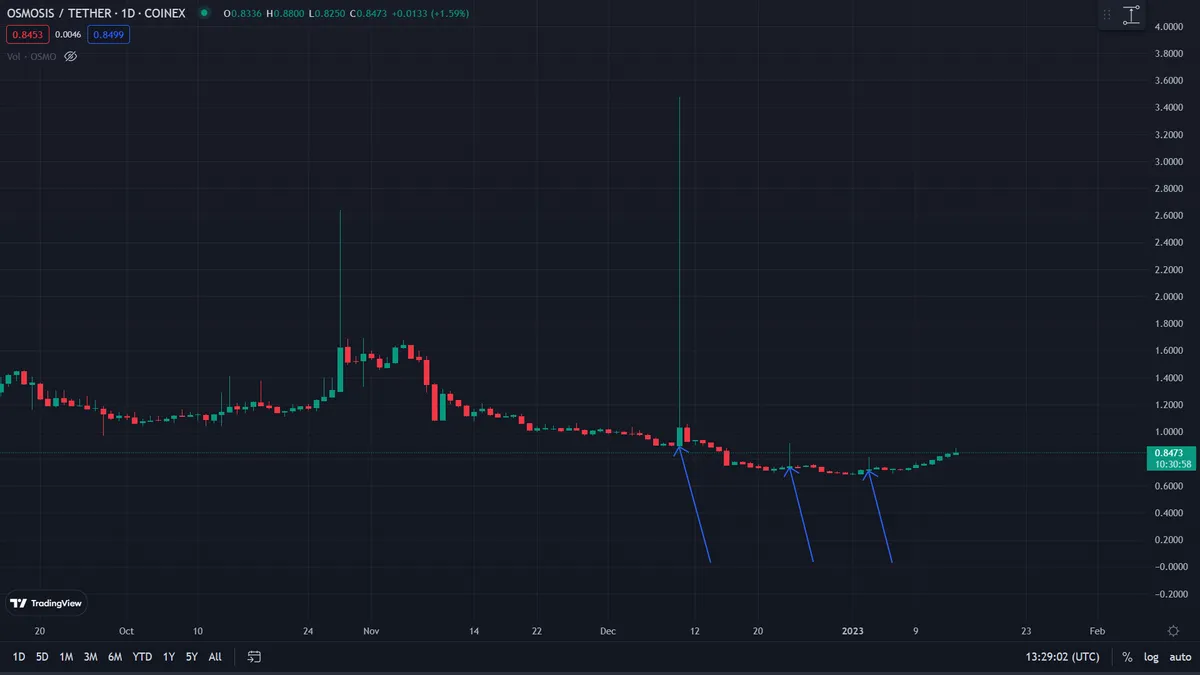
In snap shot below from www.tradingview.com three pumps of $OSMO that has been discussed in this dashboard is indicated by blue arrows.
==Bar chart on the left side shows daily USD price of $OSMO since December 2022== and as we can see There has been no change in the price of $OSMO, and considering that the price of $OSMO is stored in the database every hour, this pump movement was done in a shorter time frame, which did not affect the price of the hour.
- ==Bar chart on the left side shows daily transaction count on Osmosis network since December 2022 in which pump days are splitted,== and as we see it’s major trend is bearish and on distinguished days on first and third pump we see their behaviour as peek which shows relatively changes compared to the main trend.
- ==Bar chart on the right side shows daily transactions’ fee volume on Osmosis network since December 2022 in which pump days are splitted,== and as we see it’s major trend is fluctuated and on distinguished days on first and third pump we see their behaviour as peek which shows relatively changes compared to the main trend.
Price chart
- ==First donut chart above from the left side shows fee volume of users who has transacted on 2022-12-10 with paid fee above 0.1 $OSMO on Osmosis network,== in which total of 66.4M $OSMO has been paid by these users and user osmo1q272app7f5j5zgpjcewdajljurgansg6wqj7ke has paid most fee volume on that day with 95.5% of volume which is 63,400,000
- ==Second donut chart above from the left side shows fee volume of users who has transacted on 2022-12-24 with paid fee above 0.1 $OSMO on Osmosis network,== in which total of 16.2M $OSMO has been paid by these users and user osmo1q272app7f5j5zgpjcewdajljurgansg6wqj7ke has paid most fee volume on that day with 71.6% of volume which is 11,600,000
- ==Third donut chart above from the left side shows fee volume of users who has transacted on 2022-01-03 with paid fee above 0.1 $OSMO on Osmosis network,== in which total of 12.1M $OSMO has been paid by these users and userosmo1q272app7f5j5zgpjcewdajljurgansg6wqj7ke has paid most fee volume on that day with 83.8% of volume which is 10,200,000
- ==Bar chart on the left side shows daily transfer count on Osmosis network since December 2022 in which pump days are splitted,== and as we see it’s major trend is fluctuated and on distinguished days on first and second pumps we see their behaviour as peek which shows relatively changes compared to the main trend.
- ==Bar chart on the right side shows daily transfer volume on Osmosis network since December 2022 in which pump days are splitted,== and as we see it’s major trend is fluctuated and on distinguished days on all pumps we see their behaviour as peek which shows relatively changes compared to the main trend.
- ==First donut chart above from the left side shows transfer volume of users who has transferred on 2022-12-10 with volume above 10K $OSMO on Osmosis network,== in which tx_id 470EF52F76FB1F6A826D1E12992B71354A6232824EAB560DB58762F9ACEFF5CF has transferred most volume on that day with 26.2% of volume which is 3M
- ==Second donut chart above from the left side shows transfer volume of users who has transferred on 2022-12-24 with volume above 10K $OSMO on Osmosis network,== in which tx_id 262085AE769336FF472F1D324E4A67C3D3EC286AB4423857E51674B335825690 has transferred most volume on that day with 12.6% of volume which is 610K
- ==Third donut chart above from the left side shows transfer volume of users who has transferred on 2022-01-03 with volume above 10K $OSMO on Osmosis network,== in which tx_id E9E13C78380014A84476F7C40B287B3CEF54C7CC5213A0BA7221B13231835CBB has transferred most volume on that day with 81.5% of volume which is 552K
- ==First donut chart above from the left side shows transfer count of users who has sent assets on 2022-12-10 with volume above 100K $OSMO on Osmosis network,== in which total of 25 transfers has been sent by these users and user osmo129uhlqcsvmehxgzcsdxksnsyz94dvea907e575 has sent most transfers on that day with 40% of sent transfers which is 10
- ==Second donut chart above from the left side shows transfer count of users who has sent assets on 2022-12-24 with volume above 100K $OSMO on Osmosis network,== in which total of 21 transfers has been sent by these users and user osmo129uhlqcsvmehxgzcsdxksnsyz94dvea907e575 has sent most transfers on that day with 85.7% of sent transfers which is 18
- ==Third donut chart above from the left side shows transfer count of users who has sent assets on on 2022-01-03 with volume above 100K $OSMO on Osmosis network,== in which total of 2 transfers has been sent by these users and user osmo129uhlqcsvmehxgzcsdxksnsyz94dvea907e575 has sent most transfers on that day with 100% of sent transfers which is 2
- ==First donut chart above from the left side shows transfer volume of users who has sent assets on 2022-12-10 with volume above 100K $OSMO on Osmosis network,== in which total volume of 11.5M has been sent by these users and user osmo129uhlqcsvmehxgzcsdxksnsyz94dvea907e575 has sent most volume on that day with 64% of sent transfers which is 7.37M
- ==Second donut chart above from the left side shows transfer volume of users who has sent assets on 2022-12-24 with volume above 100K $OSMO on Osmosis network,== in which total volume of 4.8M has been sent by these users and user osmo129uhlqcsvmehxgzcsdxksnsyz94dvea907e575 has sent most volume on that day with 77.7% of sent transfers which is 3.7M
- ==Third donut chart above from the left side shows transfer volume of users who has sent assets on on 2022-01-03 with volume above 100K $OSMO on Osmosis network==, in which total volume of 678K has been sent by these users and user osmo129uhlqcsvmehxgzcsdxksnsyz94dvea907e575 has sent most volume on that day with 100% of sent transfers which is 678K
- ==First donut chart above from the left side shows transfer count of users who has received assets on 2022-12-10 with volume above 100K $OSMO on Osmosis network,== in which total of 25 transfers has been received by these users and users osmo129uhlqcsvmehxgzcsdxksnsyz94dvea907e575 and osmo1krmqr8zhvteevq4hnl7q0pxtff6xpnqz4ckxcu has received most transfers on that day with 40% of received transfers which is 10 for both.
- ==Second donut chart above from the left side shows transfer count of users who has received assets on 2022-12-24 with volume above 100K $OSMO on Osmosis network,== in which total of 21 transfers has been received by these users and user osmo1krmqr8zhvteevq4hnl7q0pxtff6xpnqz4ckxcu has received most transfers on that day with 85.7% of received transfers which is 18
- ==Third donut chart above from the left side shows transfer count of users who has received assets on 2022-01-03 with volume above 100K $OSMO on Osmosis network,== in which total of 2 transfers has been received by these users and user osmo1krmqr8zhvteevq4hnl7q0pxtff6xpnqz4ckxcu has received most transfers on that day with 100% of received transfers which is 2
- ==First donut chart above from the left side shows transfer volume of users who has received assets on 2022-12-10 with volume above 100K $OSMO on Osmosis network,== in which total volume of 11.5M has been received by these users and user osmo1krmqr8zhvteevq4hnl7q0pxtff6xpnqz4ckxcu has received most volume on that day with 64.1% of received transfers which is 7.37M
- ==Second donut chart above from the left side shows transfer volume of users who has received assets on 2022-12-24 with volume above 100K $OSMO on Osmosis network,== in which total volume of 4.8M has been received by these users and user osmo1krmqr8zhvteevq4hnl7q0pxtff6xpnqz4ckxcu has received most volume on that day with 77.7% of received transfers which is 3.7M
- ==Third donut chart above from the left side shows transfer volume of users who has received assets on 2022-01-03 with volume above 100K $OSMO on Osmosis network==, in which total volume of 678K has been received by these users and user osmo1krmqr8zhvteevq4hnl7q0pxtff6xpnqz4ckxcu has received most volume on that day with 100% of received transfers which is 678K
- ==Bar chart on the left side shows daily swap count from $OSMO on Osmosis network since December 2022 in which pump days are splitted,== and as we see it’s major trend is fluctuated and on distinguished days on all pumps we see their behaviour as peek which shows relatively considerable changes compared to the main trend.
- ==Bar chart on the right side shows daily swap volume from $OSMO on Osmosis network since December 2022 in which pump days are splitted,== and as we see it’s major trend is fluctuated and on distinguished days on first and third pump we see their behaviour as peek which shows relatively considerable changes compared to the main trend.
- ==First donut chart above from the left side shows swap volume of users who has swapped from $OSMO on 2022-12-10 with volume above 1K $OSMO on Osmosis network,== in which user osmo1tqctx98qz2aa25j5knzuztxaerl3z0ld8q6c72 has swapped most volume on that day with 14% of volume which is 492K
- ==Second donut chart above from the left side shows swap volume of users who has swapped from $OSMO on 2022-12-24 with volume above 1K $OSMO on Osmosis network,== in which user osmo16tz3zjch9xpxkkh07758p0kpy2eag4vh0ll8v5 has swapped most volume on that day with 44.8% of volume which is 480K
- ==Third donut chart above from the left side shows swap volume of users who has swapped from $OSMO on 2022-01-03 with volume above 1K $OSMO on Osmosis network,== in which user osmo16tz3zjch9xpxkkh07758p0kpy2eag4vh0ll8v5 has swapped most volume on that day with 31.4% of volume which is 326K
Swaps
-
==First donut chart above from the left side shows swap volume of tokens which has been swapped from $OSMO on 2022-12-10 with volume above 1K $OSMO on Osmosis network,== in which user USDC has swapped from $OSMO with most volume on that day with 55.6% of volume which is 1.83M, other next two tokens with considerable swap volume are ATOM and WETH
-
==Second donut chart above from the left side shows swap volume of tokens which has been swapped from $OSMO on 2022-12-24 with volume above 1K $OSMO on Osmosis network,== in which user USDC has swapped from $OSMO with most volume on that day with 44.8% of volume which is 468K, other next two tokens with considerable swap volume are ATOM and WBTC
-
==Third donut chart above from the left side shows swap volume of tokens which has been swapped from $OSMO on 2022-01-03 with volume above 1K $OSMO on Osmosis network,== in which user ATOM has swapped from $OSMO with most volume on that day with 38.6% of volume which is 389K, other next two tokens with considerable swap volume are USDC and WBTC
\
- ==Bar chart on the left side shows daily swap count to $OSMO on Osmosis network since December 2022 in which pump days are splitted,== and as we see it’s major trend is fluctuated and on distinguished days on first and third pumps we see their behaviour as peek which shows relatively considerable changes compared to the main trend.
- ==Bar chart on the right side shows daily swap volume to $OSMO on Osmosis network since December 2022 in which pump days are splitted,== and as we see it’s major trend is fluctuated and on distinguished days we don’t see any particular behaviour on them.
- ==First donut chart above from the left side shows swap volume of users who has swapped to $OSMO on 2022-12-10 with volume above 1K $OSMO on Osmosis network,== in which user osmo1gren0yydnxapxhx86gzlwalkq29kzy880er08m has swapped most volume on that day with 19.8% of volume which is 59K
- ==Second donut chart above from the left side shows swap volume of users who has swapped to $OSMO on 2022-12-24 with volume above 1K $OSMO on Osmosis network,== in which user osmo1yahqzw5a3x0n99nm9sll59ruulzgu2g6669ceu has swapped most volume on that day with 20.8% of volume which is 263K
- ==Third donut chart above from the left side shows swap volume of users who has swapped to $OSMO on 2022-01-03 with volume above 1K $OSMO on Osmosis network,== in which user osmo1449vxgw3na3w993s80mdzrg3eegtx4n2g3fqjn has swapped most volume on that day with 31.4% of volume which is 80K
- ==First donut chart above from the left side shows swap volume of tokens which has been swapped to $OSMO on 2022-12-10 with volume above 1K $OSMO on Osmosis network,== in which user ATOM has swapped from $OSMO with most volume on that day with 74% of volume which is 5.2M, other next two tokens with considerable swap volume are USDC and WETH
- ==Second donut chart above from the left side shows swap volume of tokens which has been swapped to $OSMO on 2022-12-24 with volume above 1K $OSMO on Osmosis network,== in which user USDC has swapped from $OSMO with most volume on that day with 49.7% of volume which is 521K, other next two tokens with considerable swap volume are ATOM and JUNO
- ==Third donut chart above from the left side shows swap volume of tokens which has been swapped to $OSMO on 2022-01-03 with volume above 1K $OSMO on Osmosis network,== in which user USTC has swapped from $OSMO with most volume on that day with 52.4% of volume which is 886K, other next two tokens with considerable swap volume are ATOM and JUNO
Stake & unstake
- ==Bar chart on the left side shows daily stake volume of $OSMO on Osmosis network since December 2022 in which pump days are splitted,== and as we see it’s major trend is fluctuated and on distinguished days on first pump we see huge spike which shows relatively considerable changes compared to the main trend.
- ==Bar chart on the right side shows daily swap volume from $OSMO on Osmosis network since December 2022 in which pump days are splitted,== and as we see it’s major trend is fluctuated and on distinguished days we don’t see any particular behaviour on them.
- The graphs above show that there were a lot of stakes/unstakes in those days, so the network is healthy and this pumping did not affect the network from the point of view of stakes, and it happened to be more in those days, so instead of selling $OSMO, users staked it.
- ==First donut chart above from the left side shows stake volume of users who has staked $OSMO on 2022-12-10 with volume above 100 $OSMO on Osmosis network,== in which user osmo1rqzgjeauamr5g707s5ka5na8p83u6ftkus4u4r has staked most volume on that day with 73.2% of volume which is 1.3M
- ==Second donut chart above from the left side shows stake volume of users who has swapped to $OSMO on 2022-12-24 with volume above 100 $OSMO on Osmosis network,== in which user osmo1rv6mwrrct5r0slr9tkr9k2y8um2r2htsa54fd9 has staked most volume on that day with 41.5% of volume which is 51K
- ==Third donut chart above from the left side shows stake volume of users who has swapped to $OSMO on 2022-01-03 with volume above 100 $OSMO on Osmosis network,== in which user osmo1tdrq5vs8wkun9nppxgdrk25j66zvm6keanlx6q has swapped most volume on that day with 24.6% of volume which is 68K
- ==First donut chart above from the left side shows stake volume of users who has staked $OSMO on 2022-12-10 with volume above 100 $OSMO on Osmosis network,== in which user osmo130mdu9a0etmeuw52qfxk73pn0ga6gawktly65g has staked most volume on that day with 73.2% of volume which is 189K
- ==Second donut chart above from the left side shows stake volume of users who has swapped to $OSMO on 2022-12-24 with volume above 100 $OSMO on Osmosis network,== in which user osmo1rv6mwrrct5r0slr9tkr9k2y8um2r2htsa54fd9 has staked most volume on that day with 41.5% of volume which is 21.9K
- ==Third donut chart above from the left side shows stake volume of users who has swapped to $OSMO on 2022-01-03 with volume above 100 $OSMO on Osmosis network,== in which user osmo1t97zdt3grej5z5w85wkw6rsx75rwnhmt0jjw62 has swapped most volume on that day with 24.6% of volume which is 49.9K
LP actions
- ==Bar chart on the left side shows daily LP action count of $OSMO on Osmosis network since December 2022 in which pump days are splitted,== and as we see it’s major trend is fluctuated and on distinguished days on first and third pumps we see their behaviour as peek which shows relatively considerable changes compared to the main trend.
- ==Bar chart on the right side shows daily LP action volume from $OSMO on Osmosis network since December 2022 in which pump days are splitted,== and as we see it’s major trend is fluctuated and on distinguished days on first and third pumps we see their behaviour as peek which shows relatively considerable changes compared to the main trend.
-
==First donut chart above from the left side shows LP action volume of users on 2022-12-10 with volume above 1K on Osmosis network,== in which user osmo1mgp3qs92rj58yv90a82a4s4xjc7xw4qexuc8wq has staked most volume on that day with 56.4% of volume which is 367K
-
==Second donut chart above from the left side shows LP action volume of users on 2022-12-24 with volume above 1K on Osmosis network,== in which user osmo1g9tdk9kcmptq033t7tp2yglpfx5kztuc279hzq has staked most volume on that day with 33.4% of volume which is 649K
-
==Third donut chart above from the left side shows LP action volume of users on 2022-01-03 with volume above 1K on Osmosis network,== in which user osmo1m49ru40c6qhcjj4cshng94h0ky9kpya93qa3hc has swapped most volume on that day with 19.3% of volume which is 77K
\
Conclusions
On distinguished pump days number of transactions and their fees has been increased, transfers has been increased but volume of transferred assets has increased more, also we see that number/volume of to/from $OSMO swaps has increased(though CHvolume of swaps to $OSMO was much lower), also volume of stakes/unstakes and LP actions has been increased.
Even though we see some changes on observed metrics, It seems that whales or exchanges caused this increase, and this increase did not last more than a few minutes, and because network was stable, this situation was not permanent and the network returned to normal.