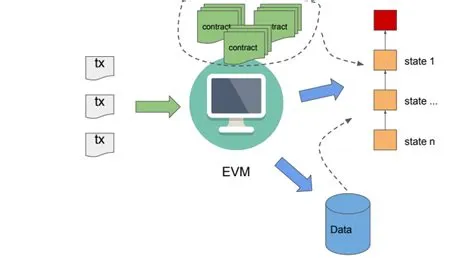
EVM - 6. Continued Growth?
The Arbitrum One ecosystem is a layer-2 mainnet which powers smart contracts that will later be validated by the Ethereum network (layer-1). Arbitrum is like the express lane of Ethereum transactions. It’s a sidechain that lets you bypass the congested main road and zip through your transactions super fast. Arbitrum is like that car-pool lane zipping along it’s own lane To use Arbitrum, you just have to use some special software to send your transactions to a node.
Polygon is a blockchain platform that enables blockchain networks to connect and scale. It aims to create a multi-chain blockchain ecosystem compatible with Ethereum. As with Ethereum, it uses a proof-of-stake consensus mechanism for processing transactions on-chain while deriving its security from Ethereum.
QUESTION
As noted in a recent piece in Cointelegraph, “Ethereum layer-2 networks, such as Polygon, Arbitrum, and Optimism, have gone through an explosive growth phase over the past couple of months, a trend that is set to continue in 2023.”
\n
Specifically, there’s been a notable increase in the amount of daily active users, volume traded, and more.
Will this growth continue into the new year? Or will L2 growth stagnate as 2023 continues to progress?
\n
Back up your assertions with data.

Optimism is a Layer 2 Optimistic Rollup network designed to utilize the strong security guarantees of Ethereum while reducing its cost and latency.Optimism Layer 2 solutions are meant to ease the burden of the Ethereum network. There are two main features to make crypto adopters excited. Optimism allows almost instantaneous transactions. Transactions on the Ethereum blockchain are nearly ten times less expensive. Considering the volume of daily transactions, these are impressive features.

ANALYSIS
On analysis of data’s for 120 days we can see that number of transaction was very high in early October 2022 but can see a downfall at the end of the month . In the Year 2023 we can see a bullish trend in the transaction count reaching upto 635k count on 6th January the trend is promising ensuring future growth . middle of the month was dull but from 16th January onwards we can see a growing curve again .
ANALYSIS
After observing the above graph we can see that highest average transaction fees was 0.18 MATIC on 8th November during ftx collapse . after that the average transaction fees was reduced & was as less as 0.0099 Matic on some days .
transaction per user was lowest in October 2022 but after October end the user became active & started doing more transaction on the network , there was again a low phase on January 6 ,2023 . It maintained an average of more 10 than on three occasions on December 6 ,2022 , January 14 , 2023 & February 2, 2023 . which indicate growth in the network .
ANALYSIS
The total volume is showing an upward growth pattern reaching upto 5B . Volume for last 120 days has also increased 2.9M till date .
daily transaction volume was high on November 11 2022 with a huge spike of about 141M . this might have been an impact of FTX collapse . It became low in November end there are few high spikes which indicates the users interaction in the network From December 25th the volume is again on an increasing scale . the volume data’s looks great in new year again & a big spike is again available on February 2 2023 ,with 67M volume in a single day .
ANALYSIS
We can see the users count was high in October13 , 2022 with
more than 729k users on a single day . Although there are ups & downs on several days . It managed to attract more than 260K users . on january 6 , 2023 we can see a huge spike of 635 k users on a single day .According to me the graph is promising . & indicates a bright future for polygon .
Add Text HereEthereum layer-2 networks have gone through an explosive growth phase over the past couple of months, a trend that is set to continue in 2023.
According to recent data, the leading layer-2 networks have seen an increase in daily active users thathas translated into a growth in fees for the respective ecosystems.
According to analytics provider Token Terminal, Polygon leads the pack with 313,457 daily active users as of Jan. 17, a metric that spiked to over 600,000 daily active users earlier in January.
That’s a 30% increase in activity since the beginning of October, resulting in nearly $55,000 worth of daily fees for Polygon.
Optimism has seen even faster growth, with a 190% gain in daily active users over the past three months. This resulted in daily network fees of $119,475, a gain of almost 140% since the beginning of the year.
Arbitrum One currently has 41,694 daily active users, an increase of around 40% over the past three months. Daily fees on the network are just over $40,000, according to the data.
source
ANALYSIS
On analysing of the above graph we see that the total number of transactions in was a continuous growth rate in terms of transaction ,till 19th January 2023, but after this date the count fall down tremendously from about 579k to 223k which is just less than half of the total count . We see a bullish approach in the beginning of the year till 17th January . The count grow from 190k on October 8 2022 to 760k on January 12th 2023. noteable thing here is that even during FTX collapse it performed well.
ANALYSIS
Average transaction fees (ETH )for optimism was highest on November 8 during ftx collapse In the last 120 days ,it was lowest on October 30th 2022. there are many small spikes & the graph is an uneven though very little deviation . There are no significant ups & downs except during FTX collapse .
transaction per user was more during FTX collapse & reached its highest of about 13 transaction per user . which was very from its lowest 5 . the graph in the new year shows large dips & spikes . the count is very low on some day & is high on the other .
ANALYSIS
The cumulative volume has reached to about 1.9M The graph was a steep slope till December beginning of 2022, but after that date the graph has a gentle slope showing that the volume although increasing is not so progressive & growth is almost stable . On February 4th ,the total daily volume was about 20k which was not very high when we compare the volume from 9th October 2022 with 15k .
So the growth is a question of concern in optimism as the graph does not show any bullish trend in the current period.
ANALYSIS
Daily transaction (ETH) was highest on November 30th 2022 with 100k volume . The graph till this date was an increasing one but after this date it followed downward trend showing low volume transactions on optimism . After new year, the graph is not an exciting one . we cannot any growth for optimism in the current scenario.
Daily users are a positive sign for the network
The user count was highest on December 21 2022, with111k users in a single day . We see that the network is able to draw users to the network on a daily basis .
This graph has fallen after 20th January 2023 . At present we cannot predict whether this downfall is short-lived or permanent for Optimism .
ANALYSIS
The daily transaction volume has been a progressive one . In the month of November & December we see the graph with very high & low counts. It was highest in November 30th with 172k ETH volume . There was another big spike on November 9th 2022 with 117k & on December 3rd 20222, with 119k volume. Beginning of the new year 2023 ,was not favourable for Arbitrum in terms of volume . After this date the graphs has become a bit bullish . The volume graph has several ups & downs in the graph , but still the graph is encouraging for the users .
ANALYSIS
On analysis we come to know that the user count in arbitrum are sporadic in nature with 25k user on October16th 2022 to 76k on October 26th . the graph is gradually going up & gradually coming down with a few major spikes on some days with about 76k users . Highest in these 120 days were on December 15th 2022, with 77K users . New year has been a good period for Arbitrum , Although 1st day was not a good day for user count as we can see as low as 34k on that day . this might be due to holiday season . There are very little deviation on some days but on ordinary day also, it was more than 25k users in a single day which shows the interest of users in this network .
ANALYSIS
Transaction per user was highest on 10th October with 19 counts for most of the days the count was not more than 12 &13. the lowest was more than 8 transactions per user which is a good figure . Start was not a good one on the first day of new year 2023, but it is showing upward trend. The increase in graph is promising showing further growth .
Daily average transaction fees was highest on November after FTX collapse . The transaction fees was growing high in new year 2023, this is a favourable sign for the pros[erity of the network .
CONCLUSION
On analysis we can observe that the growth of Polygon is the most followed by Arbitrum & Optimism respectively . We cannot predict the growth with certainty as the growth of a network is related to external factors & does not depend only on the internal factors . If we need further growth we can introduce more reward programs & incentives for developers to step in & buil a growing network with more New & Active users .
ANALYSIS
The charts for total transaction is very impressive . The users are involved in doing significant transactions . The highest in these 120 days were 831k on November 8th 829k on 9th November. On many days we can see more than 500k transactions . On very few days the transaction is less than 288k.
January 2023 is showing bullish trends for transaction so we can say that this layer2 chain is seeing growth .