Flash Bounty: LUNA Head
What's going on with LUNA, aka LUNA 2.0? Is there any unusual activity? Major whales buying or selling? What dApps are people using? Tell us the story of LUNA using the terra.core tables. Include at least three visualizations in your analysis — the best dashboards will dive deep into particularly interesting trends, outliers, or findings. They'll also be featured in a future video (so include your Twitter handle in the dashboard, and tweet it at @flipsidecrypto)!
- As you can see in the above graph, the amount of Luna transactions has started its downward trend since the last days of May, so that the amount of transactions has reached from about 54 thousand transactions to about 1000 transactions a day in August.
- Since the beginning of September, Luna's daily transaction volume has slightly increased. So that on September 9, about 15.5K successful transactions have been made. Of course, after this date, the amount of daily transactions has decreased again. So that we see approximately 1500 transactions daily.
- The average number of successful transactions per day is 3220 transactions per day
- The total number of successful Luna transactions since the end of May is 431k transactions
- If you compare the two charts above, you will see that the number of transactions in the first week of September compared to The number of transactions at the end of May is less, but the total volume of Luna transferred in these transactions is significantly higher than the transactions at the end of May.
- The average of Luna volume in successful transactions per day is 4.37M
- The total Luna volume in transactions since the end of May is 590M
- As you can see, both in terms of the number of transactions and the volume of Lunas in the transactions, the OKX project has been the most popular among users. After that, the FTX project has the second rank in terms of public popularity.
- The difference between OKX and FTX in each term of the number of transactions and also the volume of Lunas in transactions is very significant and the distance between the first and second rank is very meaningful.
- in okx, 10.6K Luna transactions have been made totally and the volume of Lunas in these transactions was nearly 33.7M in total.
Question2: Is there Major whales buying or selling?
To check the activity of the whales, we first get the sale transactions and the purchase transactions of Luna every day for each address, and in this way, we can determine how much Luna each address has in its assets every day. Then we mark the addresses that have more than 50,000 assets per day as whales.
\
- In the Luna daily transactions chart, we have divided the days into two categories, usual and unusual days. Days with a number of transactions greater than or equal to 15K transactions are considered unusual days (blue color), otherwise they are usual (orange color).
- In the Luna volume of transactions per day chart, days when the volume of Lunas in transactions is greater than or equal to 15M are considered as unusual days and are colored blue, otherwise they are orange.
The above graph shows the number of whale and normal users every day. The orange graph shows the number of whales per day.
- As you can see, the graph of the number of whales is approximately uniform and the number of whales has not changed significantly during this period.
- If we want to pay attention to the small changes in the orange graph, we can see that on September 9 (the day when the number and volume of Luna transactions also changed significantly), the number of whales has increased from about 20 whales to 32, which is the maximum number of whales in is a diagram.
- Considering that the number of whales has increased, it can be concluded that whales are being bought.
- The graph of the number of non-whale users (usual users) is similar to the graph of the number of Luna transactions per day. the number of usual users has started its downward trend since the last days of May, so that it has reached from about 6000 users to about 300 users a day in August.Since the beginning of September, umber of usual users has slightly increased. So that on September 9, the number of usual users was about 2,600. But again the number of these users decreased to about 300-400 users.
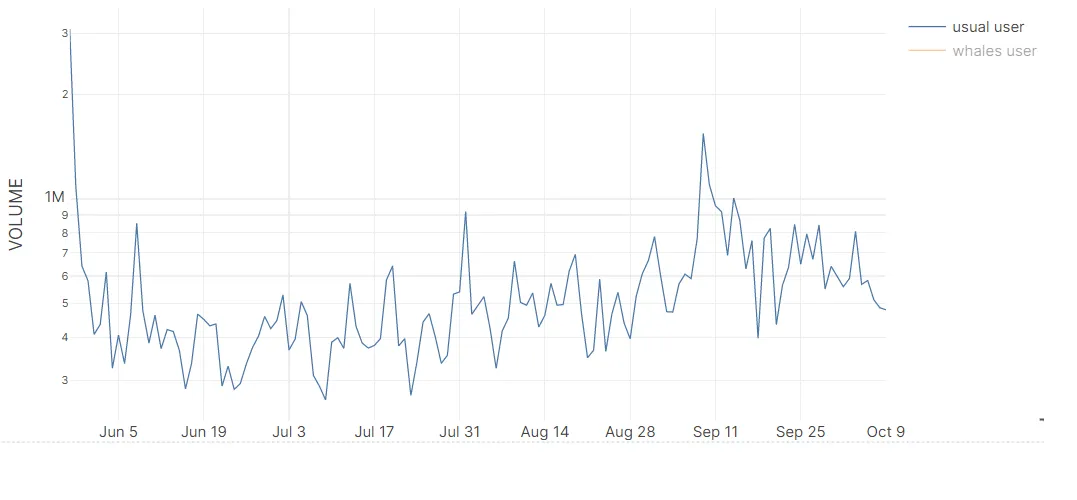
In the following, we will examine the number of transactions and the volume of holded Luna of each of the categories of ordinary users and whales.
In the above graph, we first turn off the display of whales users in order to only analyze the graph of usual users, the result of which will be the opposite graph.
As you can see, the volume of holded Luna of usual users has increased slightly until the first week of September
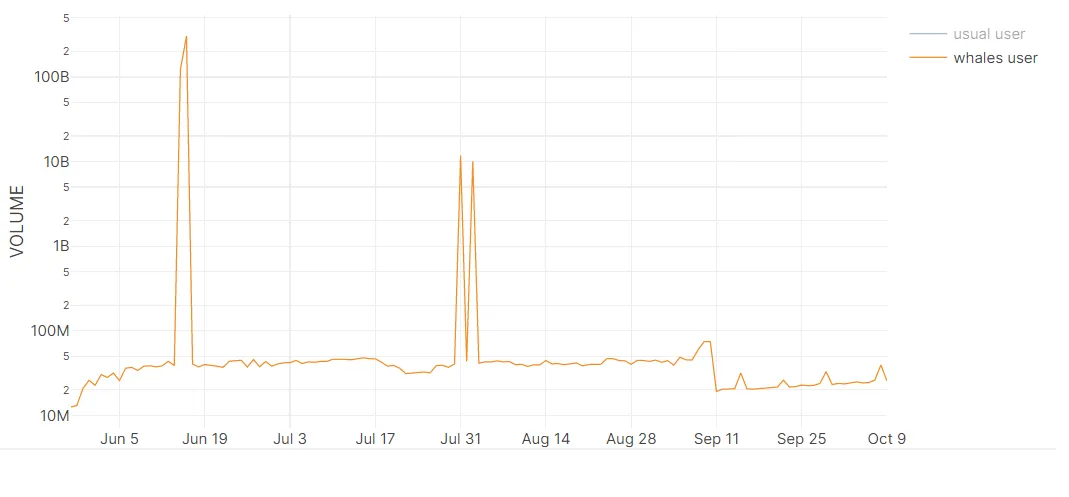
If we turn off the display of usual users in the same chart to check only the whales chart, we will get to the opposite picture.
As you can see, after September 10, the volume of whale transactions has decreased. But on three particular days, the volume of transactions of the bankers has been high; Middle of June and beginning of August.
For better analysis, the graph below shows the number of transactions for each category of normal users and whales. As you can see, the number of whale transactions has increased, especially on September 5th.