Algorand Price Correlation
This dashboard here looks into the price of the ALGO tokens over time and sees its correlation with other deeds of the network as well as with the crypto market.
Introduction
The historical correlation between Algorand and Bitcoin prices or returns is a statistical indicator of how closely these stock products tend to move in tandem. The correlation coefficient gauges how closely Bitcoin returns are tied to or correlated with Algorand results. Given a trading horizon of 90 days, Bitcoin is predicted to produce a 0.68 times greater return on investment than Algorand. Algorand is 1.47 times more dangerous than Bitcoin, nevertheless. Per unit of risk, it trades roughly -0.23 of its potential profits. Currently, Algorand is producing roughly -0.18 per unit of risk. If you were to invest 3,772,538 in Bitcoin on March 31, 2022, and then sell it today, you would lose (1,753,668), or give up 46.49 percent of the value of your portfolio over a 90-day period.
Methodology
This dashboard here attempts to see the price fluctuation of the ALGO token over time and see its correlation with ETH/BTC in the crypto network and hence tries to see if both follow some trend.This also tries to see the impact of the transactions and transfers that occur in the Network to see its correlations.
The table here displays the data necessary to analyze the query but it has an issue with the Wrapped BTC coin which always displays the value of 3.22642444e-8.Hence the ETH price is used to analyze the query.
The price of the ALGO tokens over time is displayed here and it is decreasing over time and these value corresponds to the USD value.
Both the ETH and the ALGO price of the token are charted for the same period of time and hence it both shows a decreasing trend as followed by the market but can be said that ETH has managed to keep up in between though Algorand hasn't made an upscale.
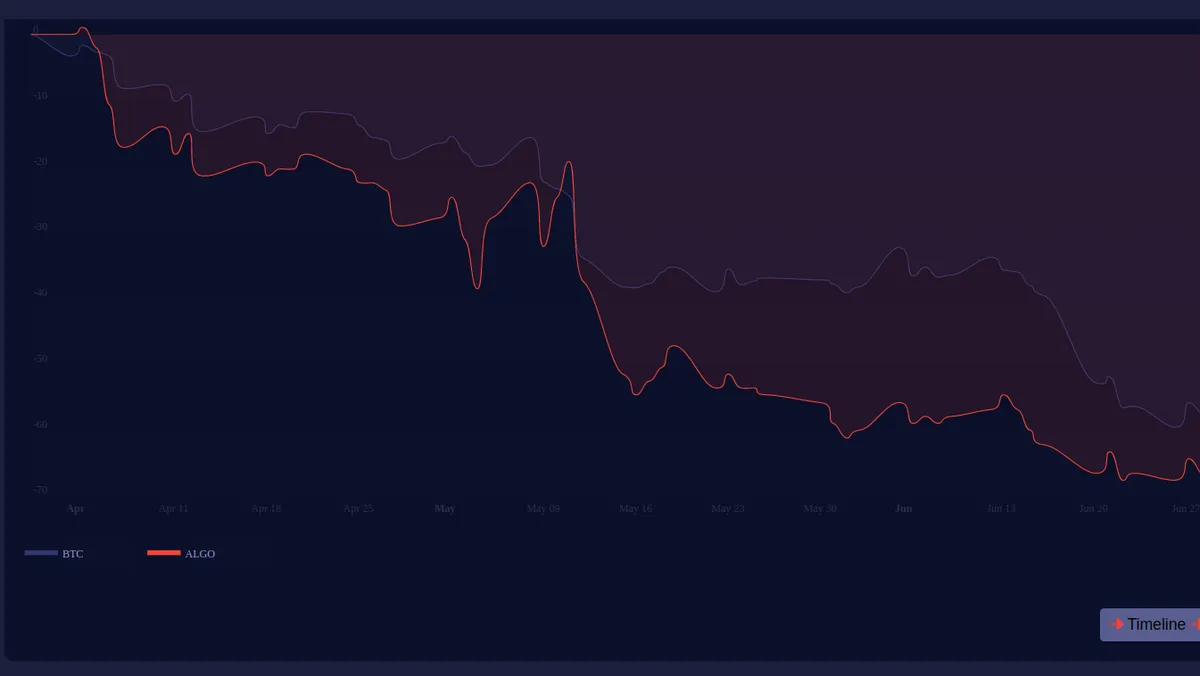
The trend as seen in BTC vs ALGO shows that both had some correlation in the flutuations.
The chart of the transactions and token transfers that occurred in the network are listed here to see the trend that are shown by the ALGO tokens in the ecosystem.
The trends here display the transactions and token transfers that occurred in the ecosystem with the ALGO price and this indicated that there is no big correlation between the two as the number of transaction/token transfers has managed to maintain almost the same trend since the scheduled timescale irrespective of the price fluctuations.
Comparing this with the SOLANA network it indicated that both ETH and SOL tokens follow the same trend in the price and thus this can be said that the price of the SOL token is depended on the market of ETH tokens.
The table that compares the price and the transactions in the Solana network is shown here.
The trends here display the transactions and token transfers that occurred in the ecosystem with the SOL price and this indicated that there is no big correlation between the two as the number of transaction/token transfers has managed to maintain almost the same trend since the scheduled timescale irrespective of the price fluctuations.BUT THIS CORRELATES WITH THE PRICE OF ETH/BTC IN THE CRYPTO WORLD.