Bridger Destinations
This dashboard gives a broad idea about the users in bridging where it has many datasets about the Bridgers in the polygon and the Ethereum network over time and then compares using the transactions and volume
INTRODUCTION
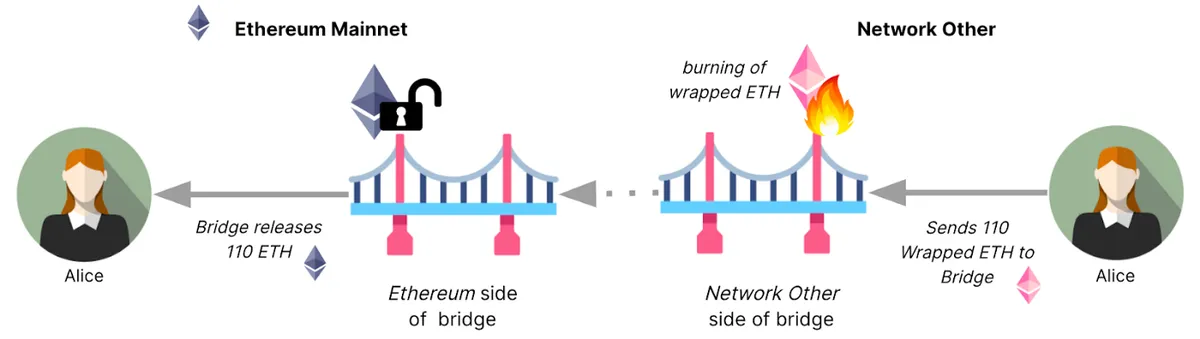
A protocol that connects two blockchains in order to allow communication between them is known as a blockchain bridge. A blockchain bridge enables you to engage in DeFi activities on the Ethereum network if you already hold bitcoin but wish to do so without selling it. In order to achieve interoperability inside the blockchain ecosystem, blockchain bridges are essential.
A blockchain bridge is a protocol that links two blockchains that are economically and technologically distinct in order to allow communication between them. These protocols serve as a virtual bridge connecting various blockchain ecosystems, which are like islands.
As a result, blockchain bridges enable interoperability, which allows digital assets and data maintained on different blockchains to communicate with one another. The foundation of the internet is interoperability: To communicate with one another, machines all over the world use a common set of open protocols. Blockchain bridges are necessary in the blockchain ecosystem, where there are several unique protocols, to enable similar ease of sharing data and value.
Blockchain bridges assist in bridging these divisions and connecting the disparate crypto ecosystems. Tokens and data may easily be traded across blockchains that are linked to one another. Blockchain bridges provide further advantages than facilitating cross-chain transactions. Users may access new protocols on other chains thanks to them, and they make it possible for developers from other blockchain communities to work together.
For more details visit:

The basic algorithm of bridges is as follows::
METHODOLOGY
The idea here follows different approaches with distinct ideas about the activities of the polygon bridges in the network. Initially, the transactions over time are charted here with different tokens, the different NFT token events, and the number of transactions. Now the destinations, the different names, the frequency of bridging, and the amount are also charted. Now the users and the transactions which are under different projects are also revealed. This is followed by the rank of each token in bridging, the number of unique wallets, and also the volume used is also accounted. The different tokens are listed with the aggregate of the bridged amount so as to see the preferred coin. Then the trend analysis is done with volume, transactions and unique active addresses by different tokens. Finally, the label currency and the volume along with different tokens are also listed to finalize the idea of bridgers.
The chart to the left clearly indicates the transactions done for bridging by the users with different events. Now it is seen that the trend was high on June 12 than any other days.
The events and the transactions over different events are also charted here and so the event is such that NFT has held the highest number of transactions.
Now the different protocol and the users over different address name is charted here and it is seen that hop protocol has the highest number of bridging users than others.
The amount of each bridging done per each protocol users are charted for here with different addresses .
Now different distinct users of the bridging ecosystem is charted with the amount of bridged transactions done which accounts for 79 % having the bridging done for 0x000… and also other tokens holding the rest of amount.
The frequency of the bridging transactions over different protocols are charted here and it is seen that the frequency is higher for hop protocol.
The transactions and the users for the whole time is charted for here.The Y axis is in logarithmic scale so as to get a better representation and also to by colour coding different projects.
The transactions over time is charted for here.It is seen that the trend is decreasing over time and there is a gap in between which accounts that there is no transaction happened in that week and also it is so less in the recent days than earlier.
The wallets over different time is charted here and it is seen that the wallets over time has also faced the same trend in dips as seen by the transactions as these wallets are responsible for the transactions done.
The sum of the amount used for transactions by the users is charted with time and this accounts for the bridging transactions done by the users.It is seen that June 13 faced the highest amount as bridged transaction.
The rank of different tokens is charted here and the chart has the rank of all tokens that are included in the bridging event.
The tokens bridged by each tokens are charted for here and it is seen that SHIB has made the highest value as the amount bridged where the same accounts for more than 82% of the total bridged amount.
The trend of unique users over time is charted for here and it is seen that the trend of the users over the period of 1 year indicates the decreasing trend.
The volume in different trend is charted for here and is also decreasing over time and hence the trend is also seen to be in the decreasing trend.
The transaction count over time is charted for here and it indicates that the transaction count has also faced the decreasing trend as the volume and the unique users.
The left donut-shaped diagram displays the overall transactions done by different currency labels and it is seen that the WETH-WETH label has the highest among all other bridges. The right figure indicates the volume of the bridging transactions done by the users where the total volume is accounted for with different currency labels and the volume here has the most done for the USDC-USDC pair by a single user
The chart into the left is another representation of the volume of the transactions done by the users in bridging over different currency labels so as to know the distribution of the volume over different labels with the USDC-USDC holding the first with acquiring more than 44.8% of the total bridged volume.