Overtime Markets - Volume
Questions: Analyze the total volume of Overtime Markets over the past two weeks. Which games received the most activity, both in total users and total $ volume? Which sports are receiving the most bets in total dollar volume on a daily basis? Explain your findings.

Quick introduction
Thales is a protocol that allows for the creation of peer-to-peer parimutuel markets that anyone can join. A Parimutuel Market is a market where the collateral is locked in a pool and the final payout to participants is not determined until after the market-settling event finalizes. There are several types of markets, including Up and Down markets, ranged markets, exotic markets, and Overtime Markets.
Overtime markets is a fully on-chain sports AMM with Chainlink sports feeds, allowing users to bet on Soccer, Football, MMA, and Baseball. For this bounty, we will be focused, on the Overtime volume on Optimism.
My goal for making this dashboard?
In this dashboard, I will calculate a few vital metrics that show Overtime markets performance during the last 2 weeks. For a better analysis, I may refer to days before this period too. Some metrics that I have shown here are: Total volume and users on a daily basis and also see volume per game and per sport to see which game and sport are more popular on the app
Key Notes:
-
Totally 534 unique users made 448k volume on overtime markets in the recent 2 weeks
-
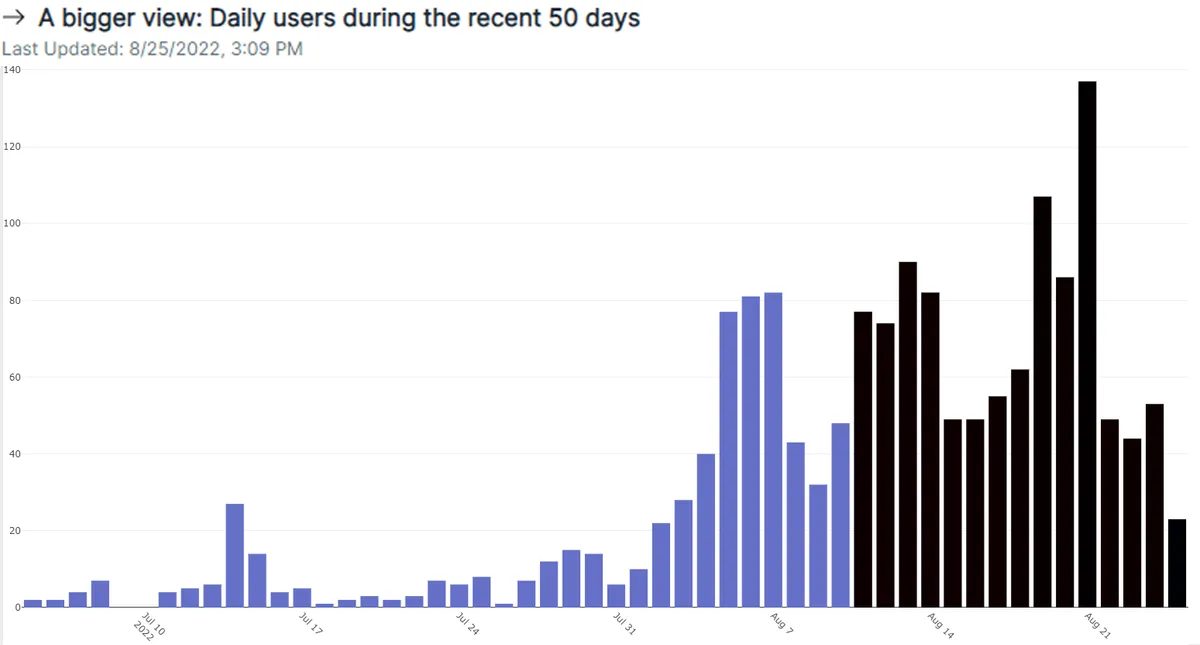
The peak of the volume occurred on Aug 14 when we saw 139k volume on a single day. This amount resulted from the action of 82 unique users on that day
-
The peak of the users occurred on Aug 21 when 137 users made transactions on the overtime markets with less volume compared to Aug 14
-
In the bigger picture, we can see most of the overtime market volume occurred during the recent 3 weeks, especially the recent 2 weeks. Before this period there was no significant volume in this market type
-
In the bigger picture in terms of the number of users we can see the same pattern. Most of the users in the overtime market came in the recent 3 weeks and especially in the recent 2 weeks. Before this period there were mostly under 20 unique users active on the overtime markets
-
Total volume has been increasing from 50 days ago until Aug 14, Since then we saw a downtrend in the volume. Same Story for the total users, we were in an uptrend until Aug 21 and after that, we saw a pullback in the number of users until today
Key Notes:
-
Among the top 12 games in these charts, we can see the Boston Red Sox vs New York Yankees game received the most activity in terms of total volume and after that Leon Edwards vs Kamaru Usman game had the most volume in the recent 2 weeks. These 2 games had more than 33% share of total volume in overtime markets
-
In terms of users, over the past 2weeks, Baltimore Orioles vs Boston Red Sox game had the most users ( 53 unique users) and after that Manchester United vs Liverpool had the most user activity ( 24 unique users). These 2 games include more than 31% of total user activity in the overtime markets
-
Based on this data, games related to the Boston Red Sox team received the most volume and user activity in the past 2 weeks


Conclusions
-
Based on the last section we can conclude most volumes in overtime markets are around basketball games. over the past 14 days, we had 10 days with basketball sport dominating over the other sports
\
-
Basketball sports had more than 55.3% share of total volume in the overtime markets in the recent 2 weeks. Soccer, MMA, and American footballs are the next ones
\
-
Among Basketball teams, the Boston Red Sox team received the most volume
\
-
On the first 2 days of the recent 2 weeks, we had no soccer game volume. Since day 3 we can see Soccer volume appeared and increased until Aug 20 and since then decreased until today
\
-
On 3 days in these 2 weeks, we hadn't any MMA-related volume while the biggest MMA volume took place on Aug 19
-
American Football had the lowest volume among sports in the overtime markets over the past 2 weeks. The highest American football-related volume occurred on Aug 13 and the rest of the days in this period we had much less volume on this sport
\
-
Over time markets are new, The more time passes the more time markets are being famous as we had the highest daily volumes and daily users in the recent 2-3 weeks. While users are more active in recent weeks there were only around 500 users and half of a million dollar volume on the related markets. Considering the overall trend of volume and number of users been upward until now then these numbers could easily go much more up as they are very very small in the vast crypto space with millions of users and billions of volumes on games, apps, and other similar products