flow topshot play type
tiltle :
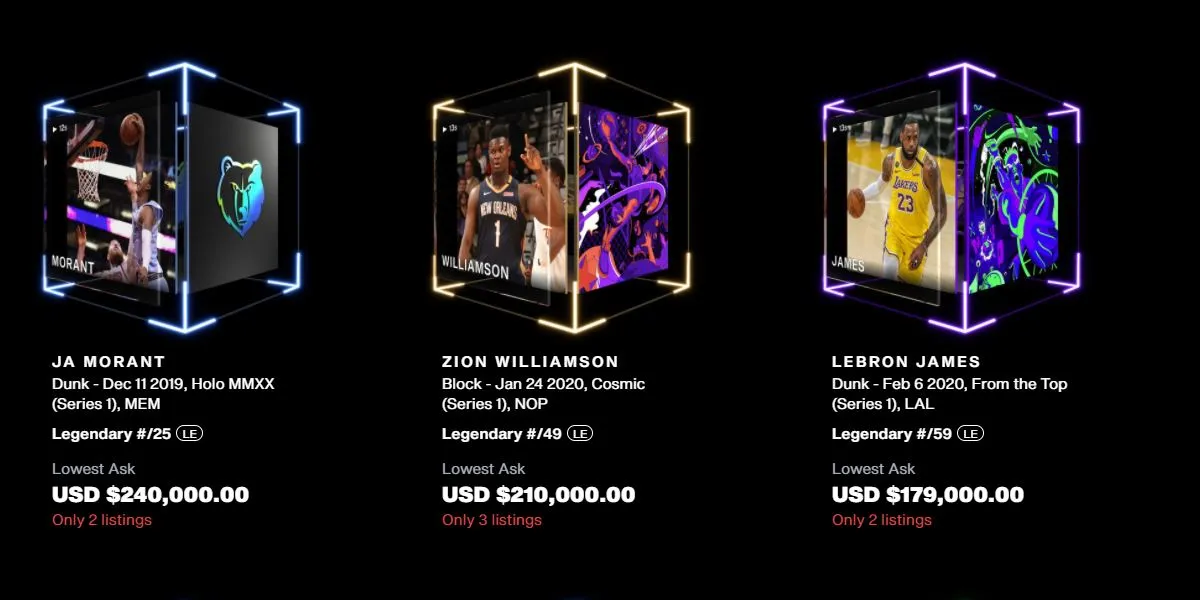
**NBA TOPSHOT moments**
Questions :
Create an analysis on NBA Top Shots moments and attempt to uncover any correlations between a specific category and sales volume.
\n
This week, focus specifically on the play_type column in the flow.core.dim_topshot_metadata table. What play_types do users hold most, and how much volume in sales do these play_types generate? Include any other transactional metrics you can think of.
Create an analysis on NBA Top Shots moments and attempt to uncover any correlations between a specific category and sales volume.
we used PLAY_TYPE , PLAY_CATEGORY and MOMENT_DESCRIPTION column of flow.core.dim_topshot_metadata table and we joined this table with flow.core.fact_transactions and flow.core.fact_prices to find out any correlations between a specific category and sales volume.
we found sum of flow token paid for each category each day then we multiplied its results by average of flow token price in same day ,then we calculated sum of usd paid for each category per day.
here is the query :
WITH A AS ( SELECT NFT_ID , DATE_TRUNC(DAY,BLOCK_TIMESTAMP) AS TIME_1,PRICE FROM flow.core.fact_nft_sales ),
B AS ( SELECT AVG(PRICE_USD) AS P , DATE_TRUNC(DAY,TIMESTAMP) AS TIME_2 FROM flow.core.fact_prices WHERE flow.core.fact_prices.TOKEN='Flow' GROUP BY 2 ORDER BY 2 ) SELECT PLAY_CATEGORY , SUM(P*PRICE) AS USD_ FROM A JOIN B ON A.TIME_1=B.TIME_2 JOIN flow.core.dim_topshot_metadata ON A.NFT_ID=flow.core.dim_topshot_metadata.NFT_ID GROUP BY 1 ORDER BY 2 DESC
when we divide sell volume by PLAY_CATEGORY we can see results shown above.
we also calculated the NBA TOPSHOT sell volume divided by each PLAY_TYPE in this dashboard.
an other point of view :
when we took a look into MOMENT_DESCRIPTION we saw some NFTs with same moment description .
we count number of NFTs grouped by nft description .
here is the result :
question :
This week, focus specifically on the play_type column in the flow.core.dim_topshot_metadata table. What play_types do users hold most ?
first of all we should seprate NFTs on hold and others .
in my opinion NFT on hold is an nft that not moved last month . it means its last transaction date is earlier than JUL 1st .
with this explanation now we can count held nfts of each play type with the code bellow :
WITH LAST_TIME_NFTS_SOLD AS( select MAX(BLOCK_TIMESTAMP) AS LAST_DATE , NFT_ID AS NFTs_ON_HOLD from flow.core.fact_nft_sales group by 2 order by 1 ), HOLD_NFTS AS( SELECT NFTs_ON_HOLD FROM LAST_TIME_NFTS_SOLD WHERE LAST_DATE < '2022-07-01 00:00:00.000' ) SELECT COUNT(NFTs_ON_HOLD) , PLAY_TYPE FROM HOLD_NFTS JOIN flow.core.dim_topshot_metadata ON flow.core.dim_topshot_metadata.NFT_ID=HOLD_NFTS.NFTs_ON_HOLD GROUP BY 2 ORDER BY 1 desc
and here is the last question
how much volume in sales do these play_types generate?
we used PLAY_TYPE from flow.core.dim_topshot_metadata and we also used
flow.core.fact_transactions and
flow.core.fact_prices
we found sum of flow token paid for each play type each day then we multiplied its results by average of flow token price in same day ,then we calculated sum of usd paid for each play type per day.
here is the query :
WITH A AS ( SELECT NFT_ID , DATE_TRUNC(DAY,BLOCK_TIMESTAMP) AS TIME_1,PRICE FROM flow.core.fact_nft_sales ),
B AS ( SELECT AVG(PRICE_USD) AS P , DATE_TRUNC(DAY,TIMESTAMP) AS TIME_2 FROM flow.core.fact_prices WHERE flow.core.fact_prices.TOKEN='Flow' GROUP BY 2 ORDER BY 2 ) SELECT PLAY_TYPE , SUM(P*PRICE) AS USD_ FROM A JOIN B ON A.TIME_1=B.TIME_2 JOIN flow.core.dim_topshot_metadata ON A.NFT_ID=flow.core.dim_topshot_metadata.NFT_ID GROUP BY 1 ORDER BY 2 DESC
here is the result :