Developer Activity
What is the Question?🚨
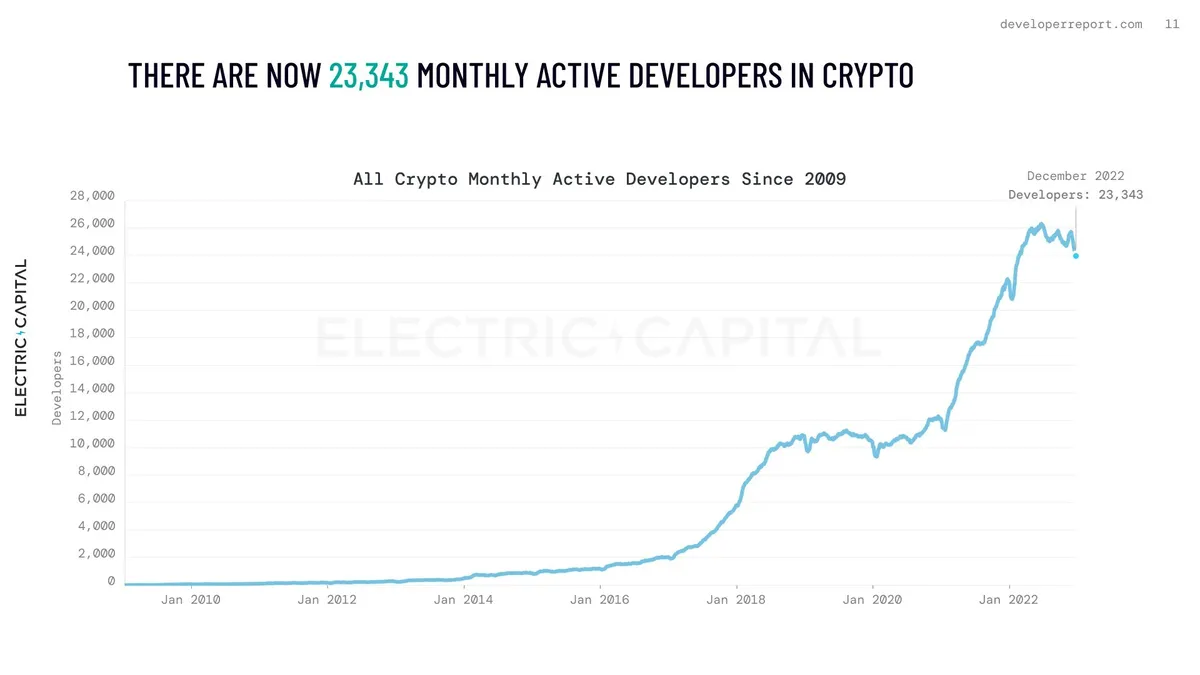
With Electric Capital’s release of its annual report on developer activity, the topic of “developers” is a hot topic across crypto.
Produce a rich analysis of NEAR developer activity, using metrics and definitions of your choice to answer the questions:
- How many developers are active on NEAR?
- How active are they?
- How this has changed over time?
Analyzed Topics:
- Contract Usage on NEAR
- Overall Statistics of NEAR Developing Environment
- NEAR Developers
- Over Time Analysis
- NEAR Developers and All Crypto Developers
Introduction🚩
> ## What Is Near Protocol and How Does It Work?
Near Protocol is a layer 1 blockchain network. It provides a platform on which developers can build decentralized applications (dapps). The most successful layer 1 blockchain is Ethereum, so protocols like Near are seen as challengers.
The key yardsticks for layer 1 networks are transaction costs, speed and the ability to maintain those features as transaction volumes grow. These factors are the focus for layer 1s like Near to improve upon Ethereum, which has encountered issues with costs and speed over the last few years.
Near Protocol is faster and cheaper than Ethereum. More importantly, it promises to be faster than some of the other largest challengers. When fully implemented, Near is expected to be able to process up to around 100,000 transactions per second (TPS). Ethereum’s largest rival, Solana, averages less than 3,000 transactions per second, according to its own blockchain explorer. Ethereum averages double-digit transactions per second. Bitcoin does less than 10.
Outside the crypto sphere, an important comparison is Visa’s (V) capacity. The global payments giant processes around 7,000-8,000 TPS, based on its claim of 232.5 billion transactions over a 12-month period. Near Protocol could eclipse that, though it has not yet realized its theoretical potential as of July 2022.
“Near has built technology to enable transactions that are fast (~1 second), quick to finality (~1-2 seconds), cheap (less than a penny), and secure,” crypto research firm Messari noted in March 2022.
More Info
Method⚡
In this dashboard, i made a deep analysis about NEAR developer activity on NEAR Github over time since 2019 and analyzed contract usage and developer stats of NEAR from different angles with the newly table on Flipside called ==“near.beta.github_activity”== .
Also at the end of the dashboard i put monthly NEAR Developers and All crypto developers that i brought the image from Electric Capital’s report .
I put parameter for date on over time charts and you can change it from the Date field at the beginning of dashboard with a dropdown menu: ==Month, Week and Day==. You should also log in to flipside to be able to interact with the parameter.
The ID in near table stands for Pull Requests,
Author stands for Developers
and Repo stands for Repositories.
Findings👀
- After experiencing a massive hype on September and October 2020, Contract deploying on NEAR went to winter sleep and woke up again on after mid 2021, reached to 10.7K active contracts on April 2021 and after that it started to drop with a gentle slope until this day. Many reasons could effect this matter but the main one in my opinion was the bearish market and users disappointment from crypto. A total of over 28K contracts were active on NEAR so far since 2020 until this day in 2023.
- 2 Bottom bar charts are showing top 20 most interacted contracts on NEAR in terms of number of transactions made and gas usage. We can clearly see that Aurora and NearCrowd contracts are in the first and second place in both charts and completely outperformed other contracts on NEAR since its launch.
- Also the third one is token.sweat which has launched recently on NEAR and as we see it performed very well and took third place so far in this short amount of time.
Findings👀
- By far, Merge state performed better than other states with over 23K pull requests over time followed by closed in the second with 22.5K. The Open state has recorded much less stats than others as we see.
- Pie charts above are showing the share of Pull requests, devs, repos and orgs between 3 Open, Merged and Closed states on NEAR Github over time. From what we see here we can conclude that Merged and Closed are pretty close on their stats and they are much more than Open state.
- In the left chart i showed the average duration between states. Open state has the highest duration among others with 439 Hours in total which means pull requests spent most of their time being Open.
Findings👀
- Above pie charts are showing some more deeper analysis about developers.
- Almost 50% of developers only made 1 pull request and 30% of them made 2 - 5 pull requests in total.
- over 65% of NEAR developers were active for only 1 month.
- 73% of NEAR Devs have 1 repository for their work on NEAR’s github and 24% of them has 2 - 10 repos.
Findings👀
- In this section, i showed some over time charts like some monthly pull requests divided by top 10 devs or repos or orgs and etc.
- In overall, NEAR developer activity were bullish and ascending with a upward trend over time since 2019. Also the highest activity of NEAR developers belongs to June 2022 which 2154 pull requests has been made by 330 developers.
- The serious activity of famous developer dependabot that we talked about it earlier has started since mid 2021.
- Left chart is showing the monthly charts in a overall perspective. The slight ascending of near developer activity by years is pretty clear here. Every year after 2019 recorded a bit more activity than its previous one and the highest belongs to 2022 with over 20.6K pull requests, 1507 devs, 577 repos and 261 orgs. The number of developers got doubled on 2022 from 2021.
Conclusion & Key Findings💡
- Near had the most active contracts in early 2022 and recorded an all-time high on April 2022 when 10.7K contracts were active together in that month and after that this number started to decrease slowly.
- Aurora and NearCrowd are the most popular contracts among NEAR users.
- A total of 52.4K pull requests has been made on NEAR github so far and 20.6K of them belong to 2022.
- Merged state got used more by developers than Closed and Open on NEAR github.
- Most of the near developers are contributors and the most popular contributors are dependabot and dependabot-preview with over 8.6K pull requests together.
- Dependabot is the most popular developer on NEAR in terms of number of pull requests, repos and orgs.
- Most of NEAR developers had 1 repository, were active for 1 month and made 1 pull request.
- 2022 has recorded the highest developer activity on NEAR github.
- According to Electric Capital’s report there were 23,343 active developers on December 2022 and according to the monthly NEAR active developers chart, 193 of them belongs to NEAR.
- NEAR developer activity is increasing slowly year by year and as i said 2022 recorded the highest activity of developers and now that we are in 2023, we should wait to see how they perform on the network and will they break their recorded from 2022 or no.
In above you can see overall stats for pull requests, developers, Repositories and orgs on NEAR Github.
Findings👀
- Majority of NEAR Developers and the actions that taking by them are contributors with over 25 pull requests from 3K developers by far and they are also accounting most of the monthly activity by developers on NEAR.
- Because most of NEAR developers are contributors, i also showed the top 10 contributors on NEAR with above bar chart and as we see, dependabot and dependabot-preview are the most active contributors on NEAR Github over time with over 4.3K pull requests in total.