
How to find NFT alpha | Solana, Madlads, Tensor example

🧠 NFT data: How to evaluate NFT projects
Today, we'll show you how to find NFT trends and to analyze NFT projects across crypto, starting with an example on MadLads, a project on Solana.
Watch this video for a detailed tutorial, or scroll down to read a quick overview👇
✏️ Tutorial overview:
1. How to find NFT data
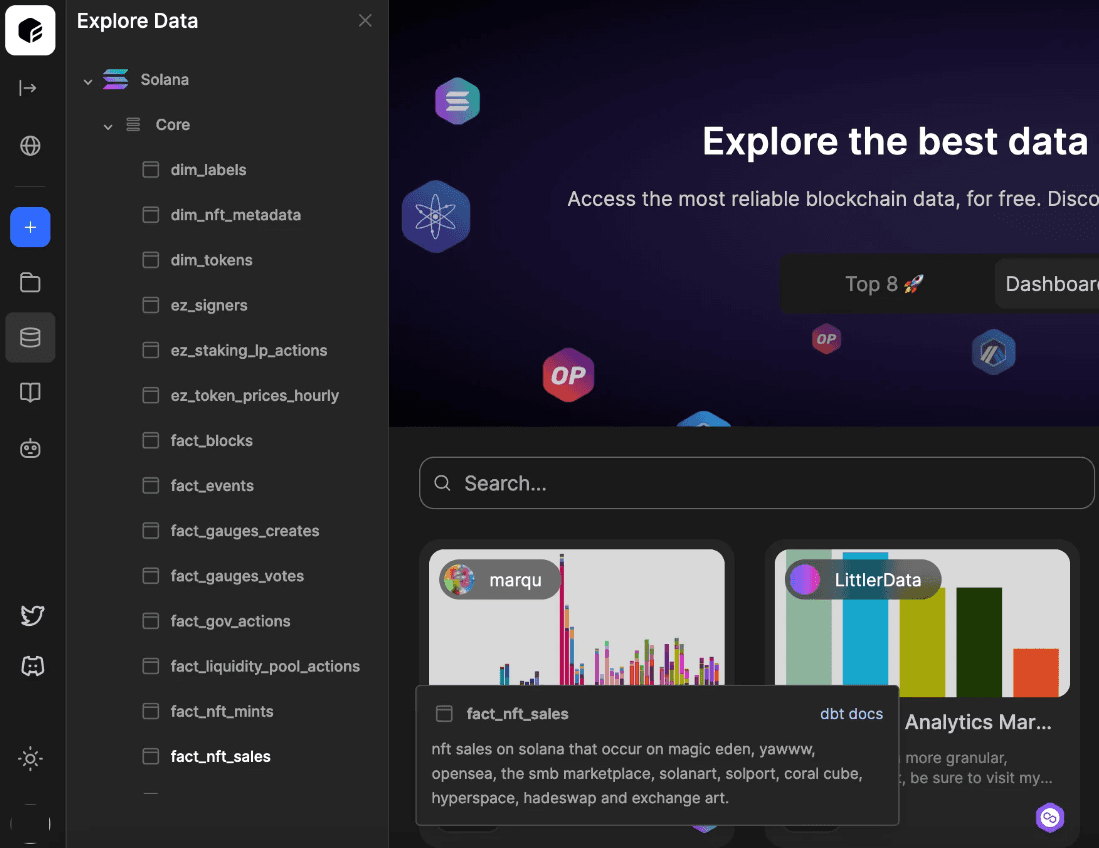
Because NFTs vary by chain and multiple chains support NFTs, there’s no one table for NFTs. In the 'Explore Data' tab in your query engine, select the chain you want to check for NFT data.
In this case we’ll select Solana, and from the drop down list we can already tell we'll mostly want what's in the nft_sales or nft_mints tables.
(Reminder: dim tables describe entities, fact tables contain pure chain data, and ez tables include added context with chain data for human-readability.)
2. How to write a good SQL query
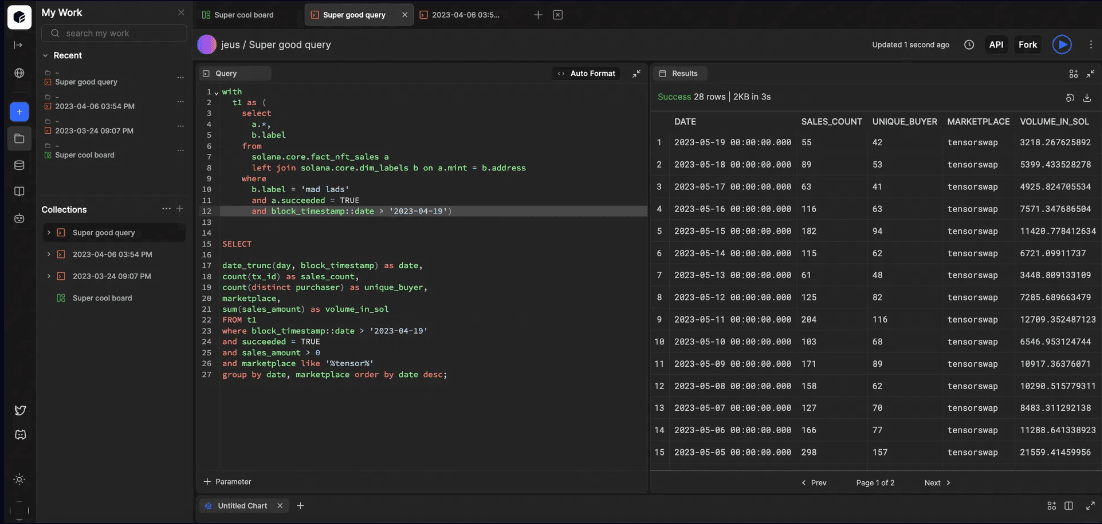
We can write a query to quickly filter through the data and find the information we actually want. So, if we want to find the daily volume of MadLads NFTs, we'll need a few things:
- with t1 as (select a.*, b.label from solana.core.fact_nft_sales a (selects one table and wraps it in the name t1)
- left join solana.core.dim_labels b (selects a second table and joins it with our first)
- on a.mint = b.address (matches the mint column to the address column across tables)
- where b.label = 'mad lads' (filters for only MadLads NFTs)
- and a.succeeded = TRUE (filters for only successful transactions)
- and block_timestamp::date > '2023-04-19') (Sets a one-month time range from today

From here, we can add the data that will end up filling the axes on our chart:
Hit the play/run button, and we should end up with a query and table looking like this:
3. How to visualize data
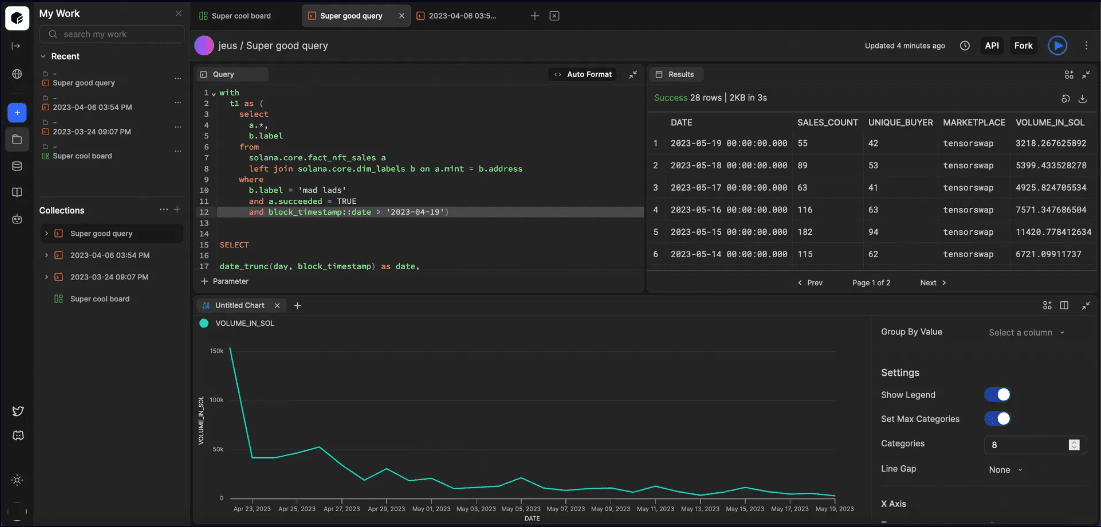
Now that we've got a working query, it's time to chart it! Simply click the 'Add chart' button in the bottom left corner of your query editor, choose your chart type (line works best in this case) and set the axes accordingly:
X axis: DATE
Y axis: VOLUME_IN_SOL
And you're all set!
4. SQL Tips and query optimization
SQL is full of tips and tricks to optimize queries or speed up your SQL workflow. Here are a few from the video:
- use the LIKE operator when you don't know the exact name of a label or column to find similar results (be sure to wrap estimated text in a % on either side)


