Tracking Polymarket Whales with FlipsideAI
Discover how to identify top Polymarket traders by profit, win rate, and activity using natural language queries. Learn to analyze whale wallets, understand market selection, position sizing, and trading behavior—all onchain, all in real time with FlipsideAI.

Prediction markets like Polymarket have become one of the most capital efficient ways to express conviction on real world outcomes — from elections to sports, from macro events to crypto currencies. But as trading volume explodes, so does the question every trader eventually asks: Who’s actually making money and how?
With FlipsideAI, anyone can now answer that question using natural language, without writing SQL or manually tracing wallets. In this post, we’ll walk through two FlipsideAI artifacts that show how users can:
- Discover top Polymarket traders by profit, win rate, and activity
- Deep-dive into a specific whale wallet reported in the news
- Understand market selection, position sizing, and trading behavior
All onchain. All in real time. All using FlipsideAI.
Getting Started: Why Track Traders on Polymarket?
Polymarket, built on the Polygon blockchain, lets users bet on real world events from politics to sports, with outcomes settled transparently via smart contracts. Top traders, often called “whales” for their massive positions, can reveal market inefficiencies, popular strategies, and emerging trends. By analyzing their profits, win rates, position sizes, and market preferences, you can refine your own approach or even mirror successful plays.
FlipsideAI makes this easy. You simply type a question like “Show me the top 10 Polymarket traders by profit/loss and win rate over the last 30 days,” and it generates a customized dashboard with charts, tables, and insights. No more sifting through raw blockchain data, everything is visualized and explained.
Discovering Top Performers: A Dashboard for Inspiration
If you’re new to trader tracking or don’t have a specific wallet in mind, start with a broad overview. The dashboard for top 5 traders by profit/loss (PnL) and win rate over a 90-day period is a goldmine. It ranks top performers, highlighting metrics like total PnL, win rates, trading volume, number of trades, markets involved, and position sizes. This helps you identify whales dominating the platform and understand their strategies.
Prompt:
Show me the top 5 Polymarket traders by profit and loss (PnL) and win rate over the last 90 days.
FlipsideAI has gone ahead to query the prediction market data and filtered specifically Polymarket and has gathered the top 5 traders by P&L and win rate below:
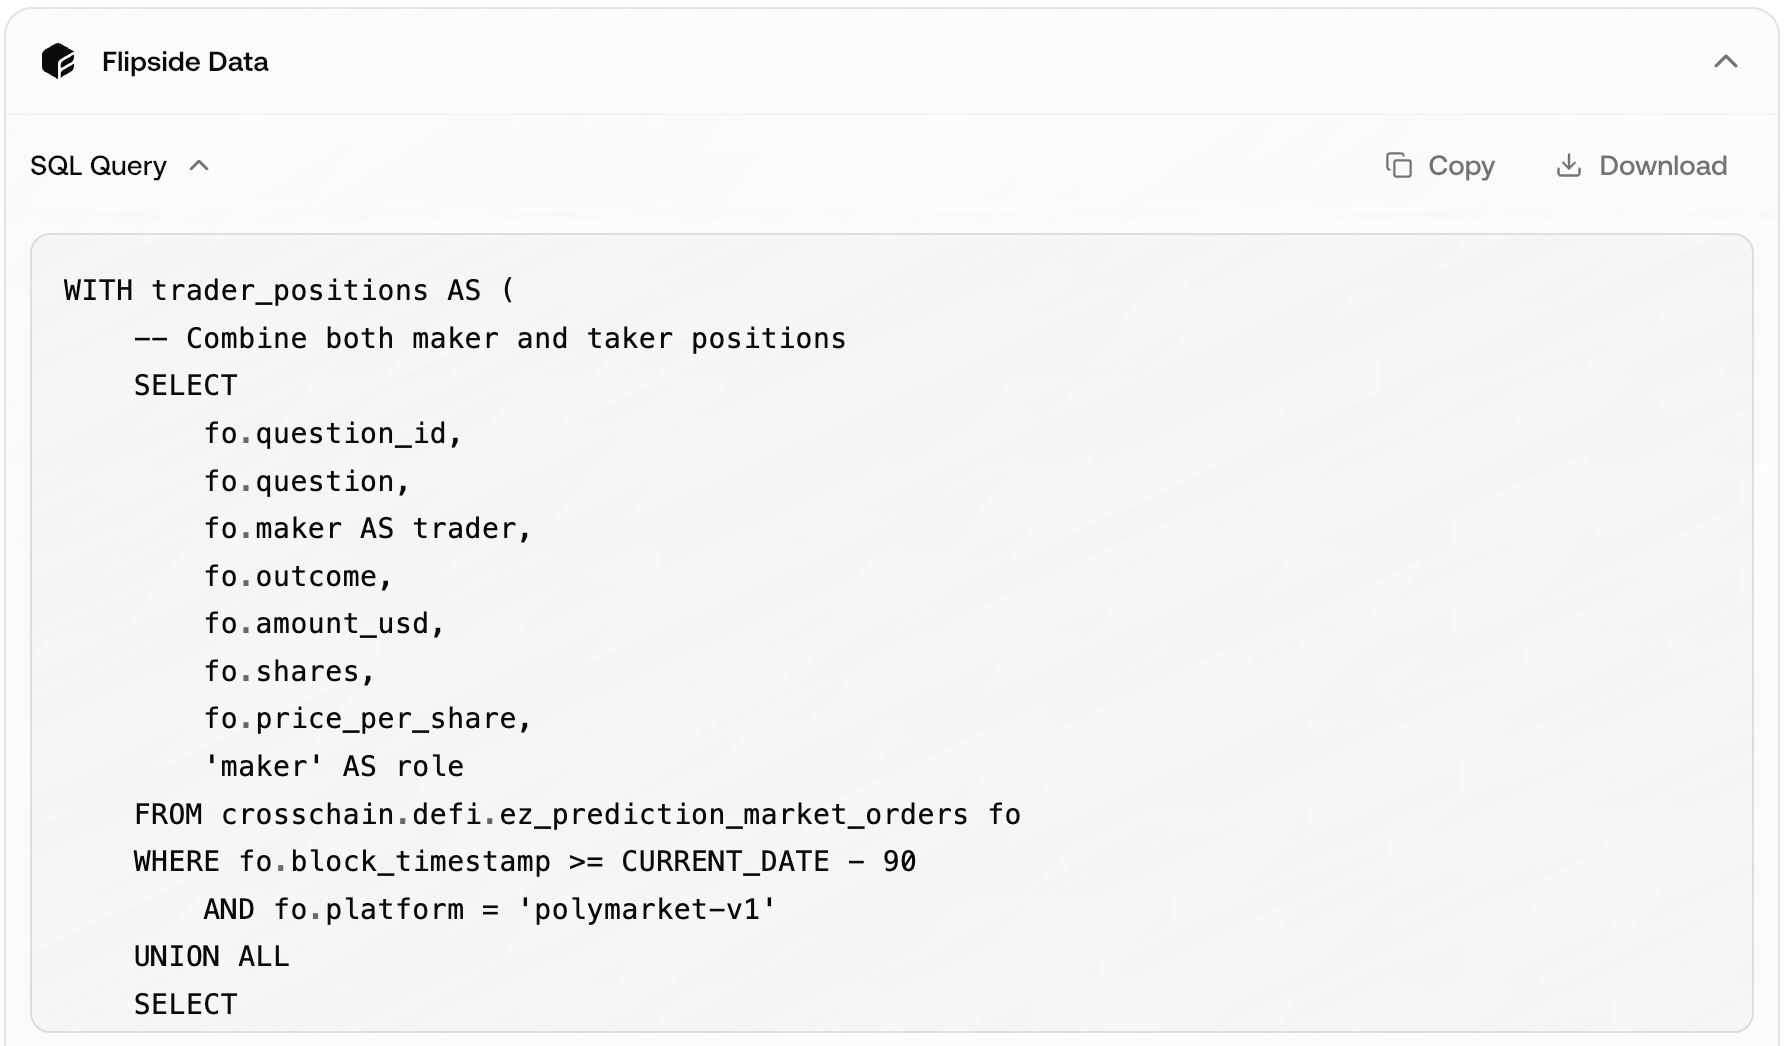
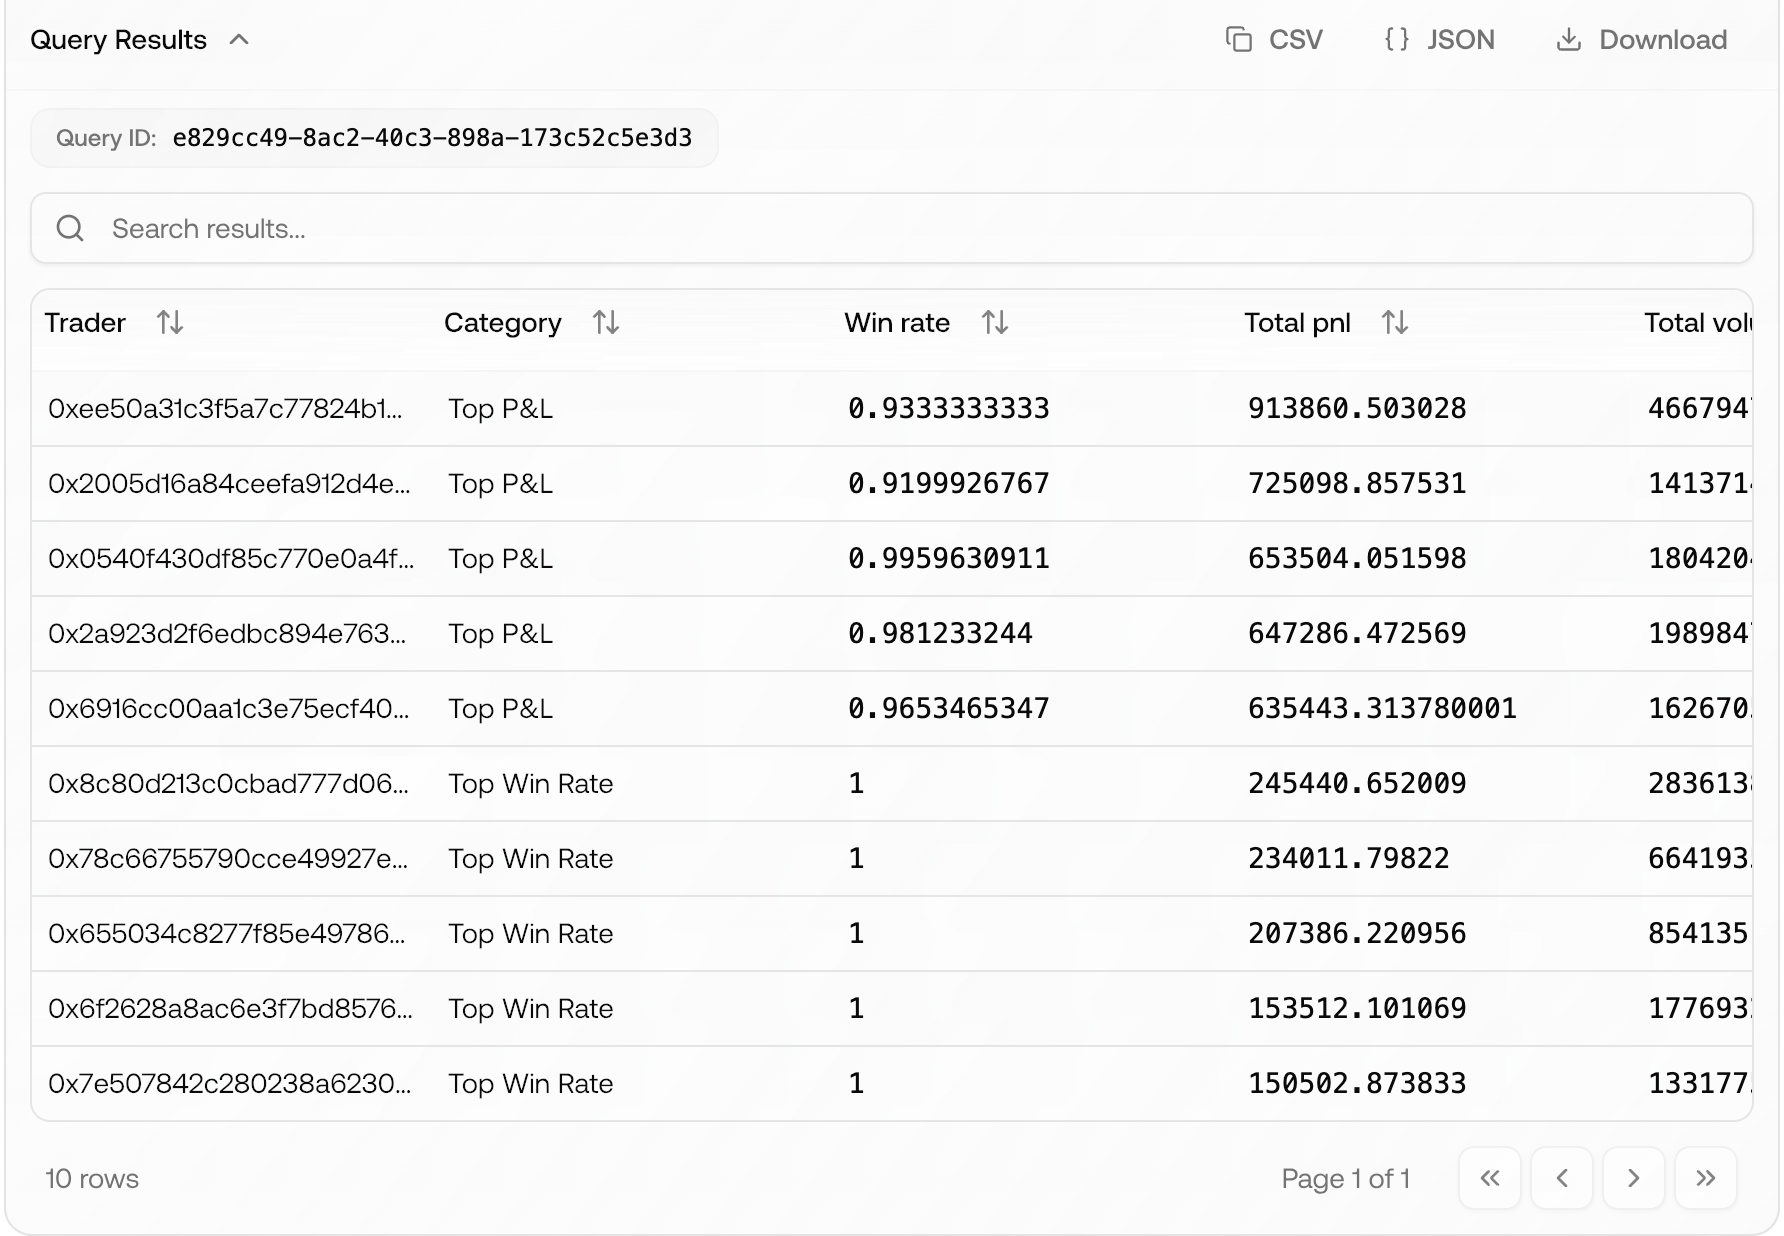
Pro Tip: Specify clearly the method to use to filter top traders so FlipsideAI can give you the results more accurately without any ambiguity. Here the prompt specifically says top traders by win rate and P&L.
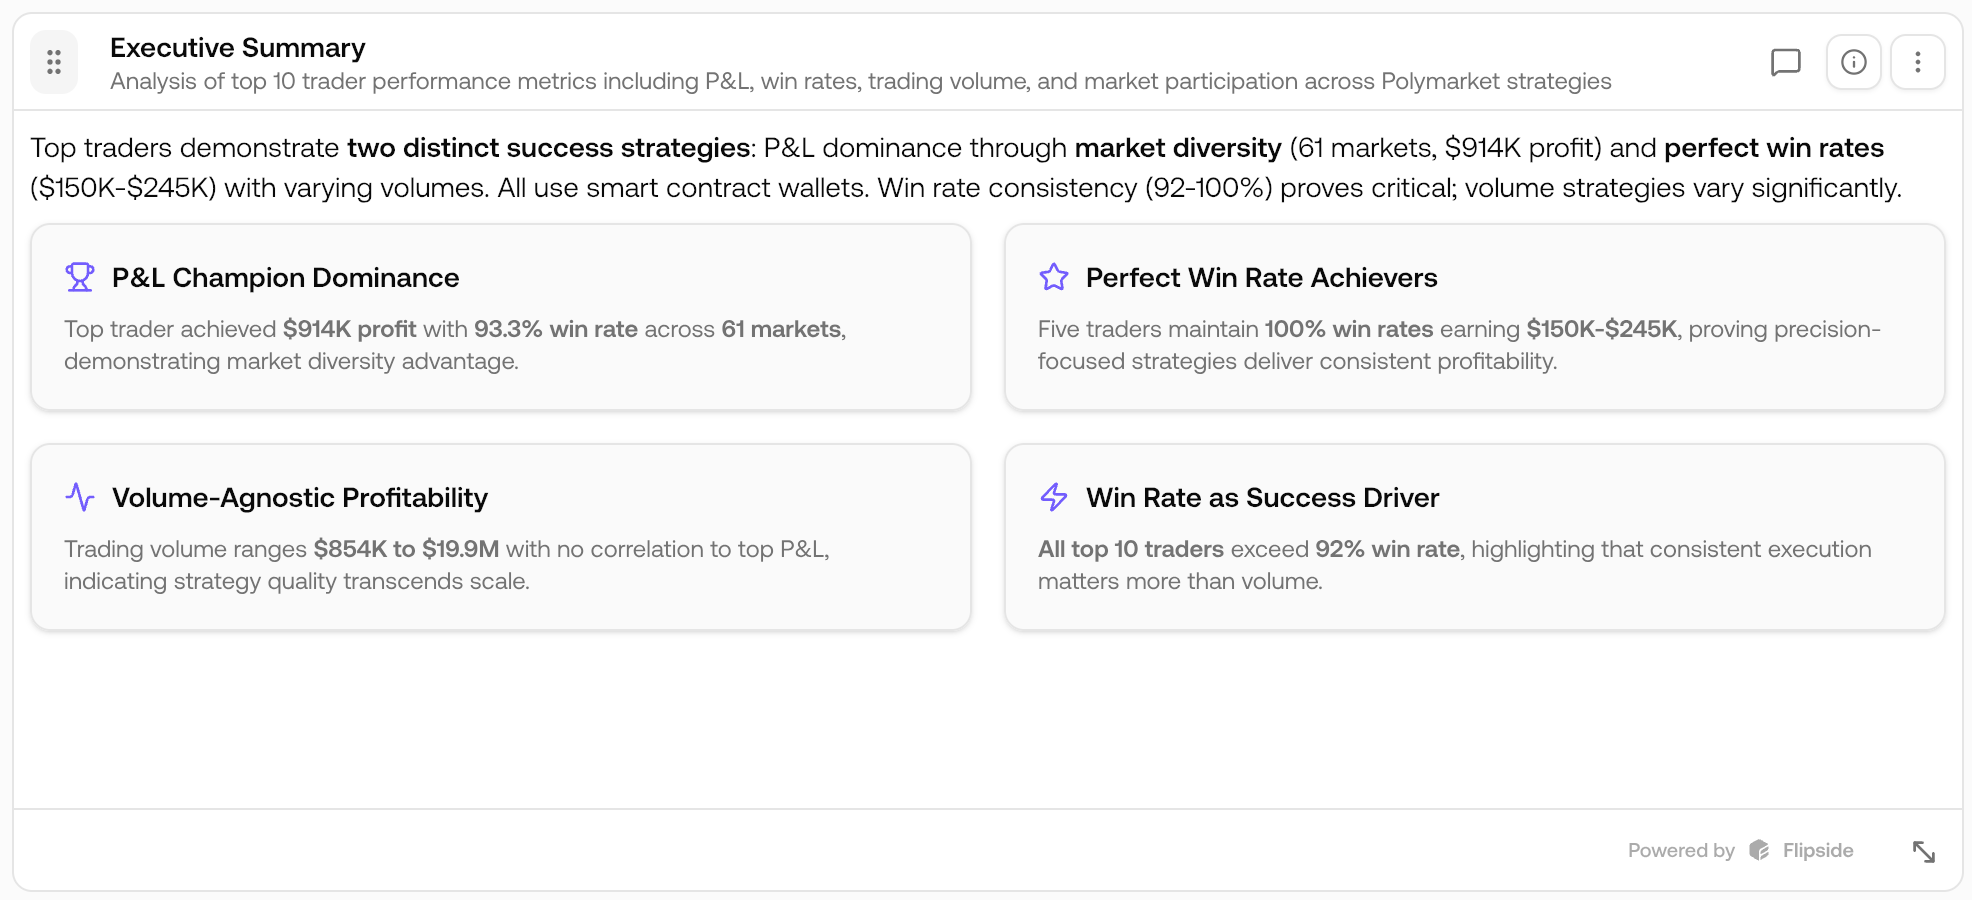
Executive Summary and Insights
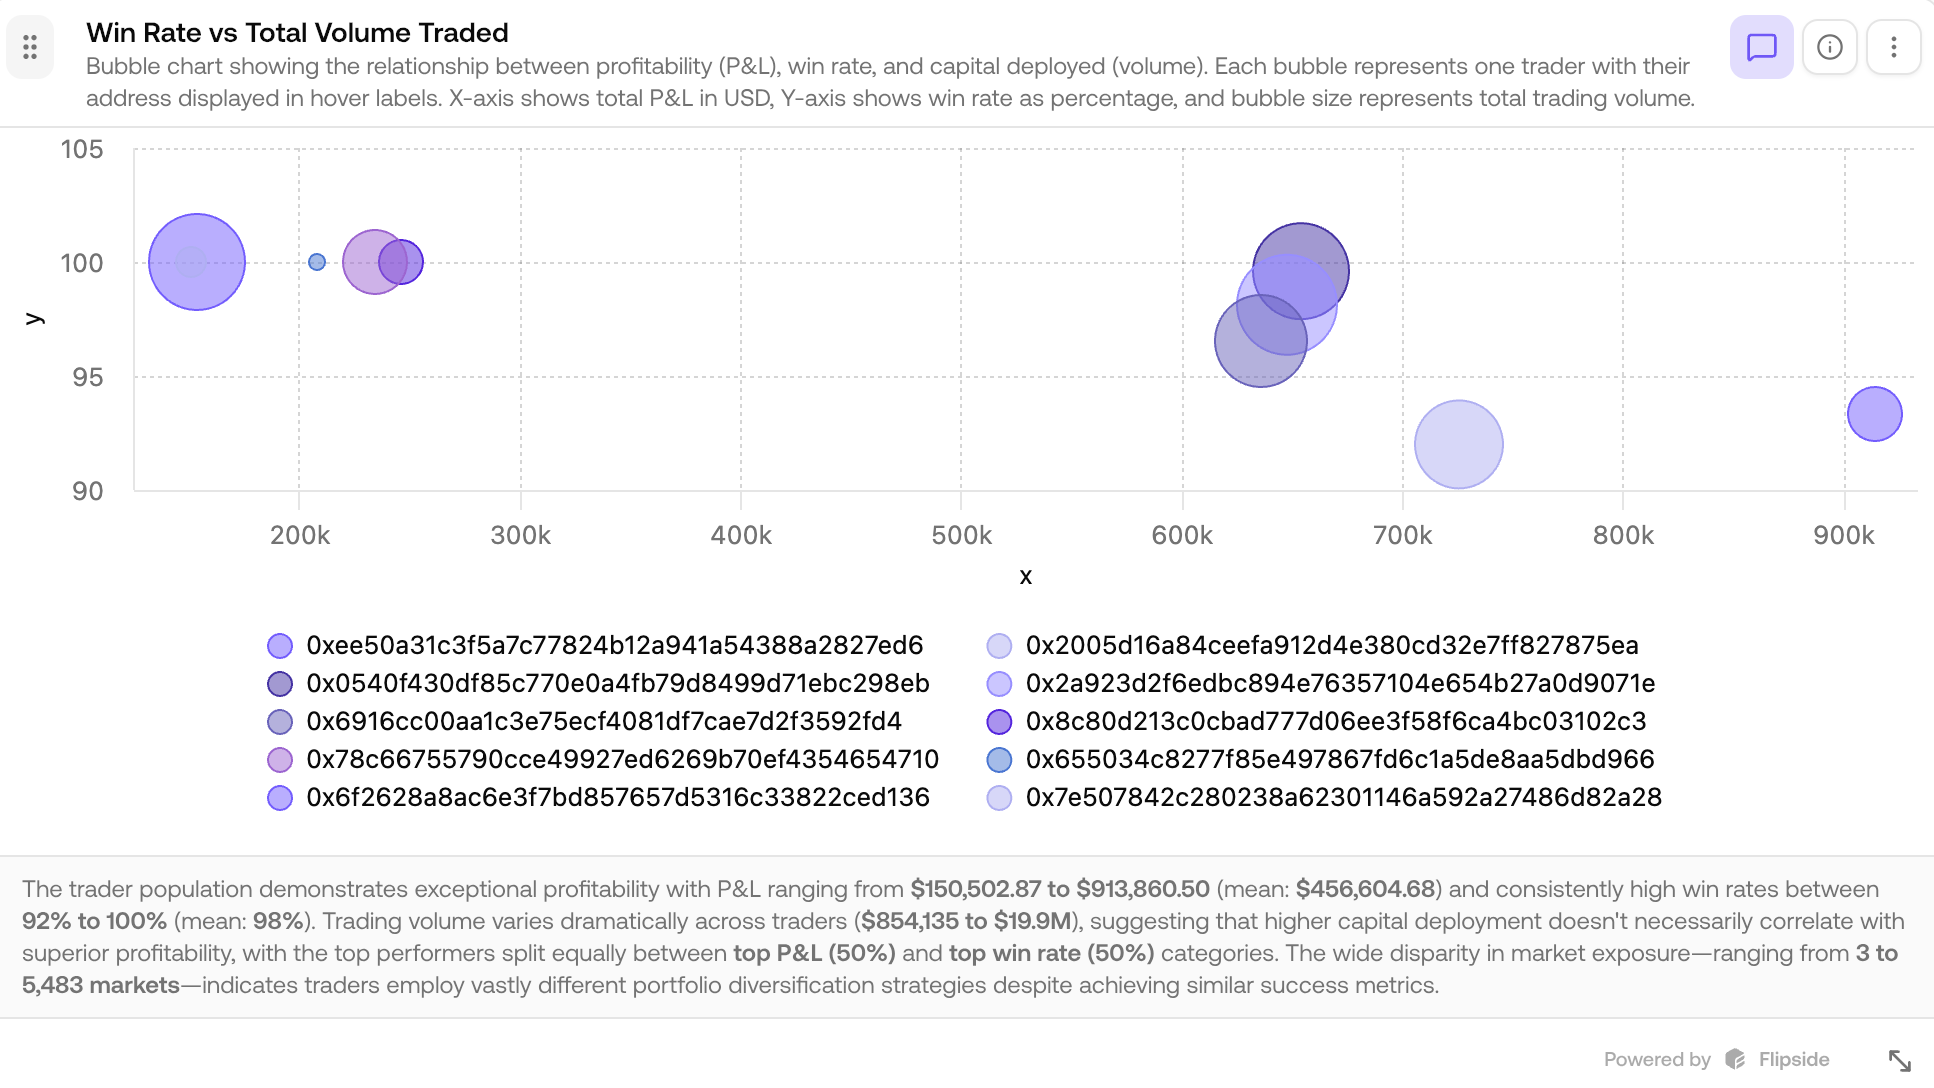
Right at the top of the artifact, you’ll encounter a comprehensive executive summary featuring AI-generated highlights that provide immediate insights into the most important patterns and achievements. For instance, the top-performing trader managed to achieve an impressive $914K in profit while maintaining an exceptionally high 93% win rate across a diverse portfolio of 61 different markets.
Additionally, the analysis reveals that there is no strong volume correlation to the top traders’ profit and loss performance, suggesting that higher trading volume doesn’t necessarily translate to better returns. However, what stands out most consistently is that the win rate from all of the top traders exceeds an impressive 92%, indicating that these successful traders prioritize accuracy and strategic positioning over sheer volume of trades.
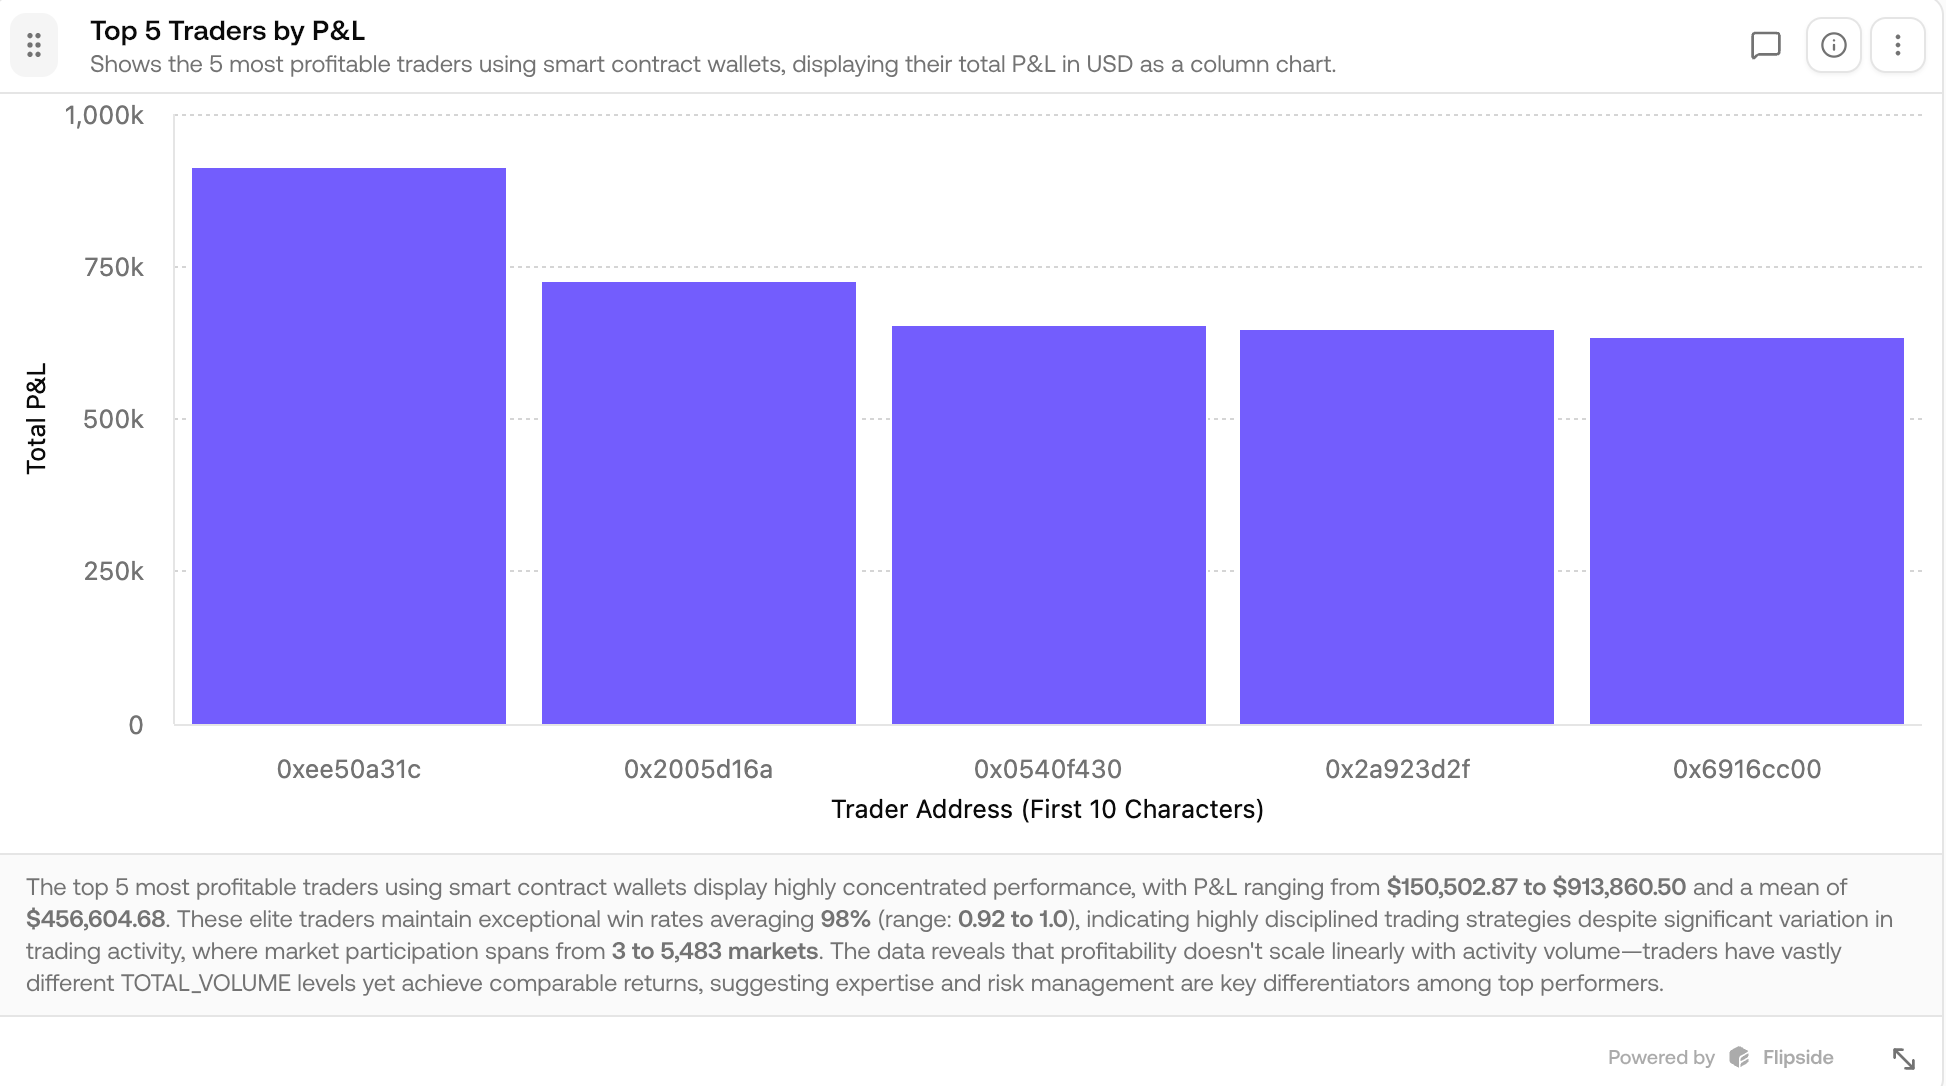
Visualizations for Quick Patterns
- A comprehensive bar chart visualization effectively displays the profit and loss (PnL) performance for each of the top 5 traders, with the data carefully organized in descending order from highest to lowest profitability, which makes it remarkably straightforward and efficient to quickly identify the top-performing leaders in the group, such as the standout trader with wallet address 0xee50a31c who achieved an impressive total of $914K in realized profits during the analyzed period.
- A bubble chart plots win rate vs. total volume traded, with bubble size representing volume, x-axis representing the P&L in USD and y-axis showing the win rate. It reveals that trading volume varies dramatically across traders ($854,135 to $19.9M), suggesting that higher capital deployment doesn’t necessarily correlate with superior profitability.
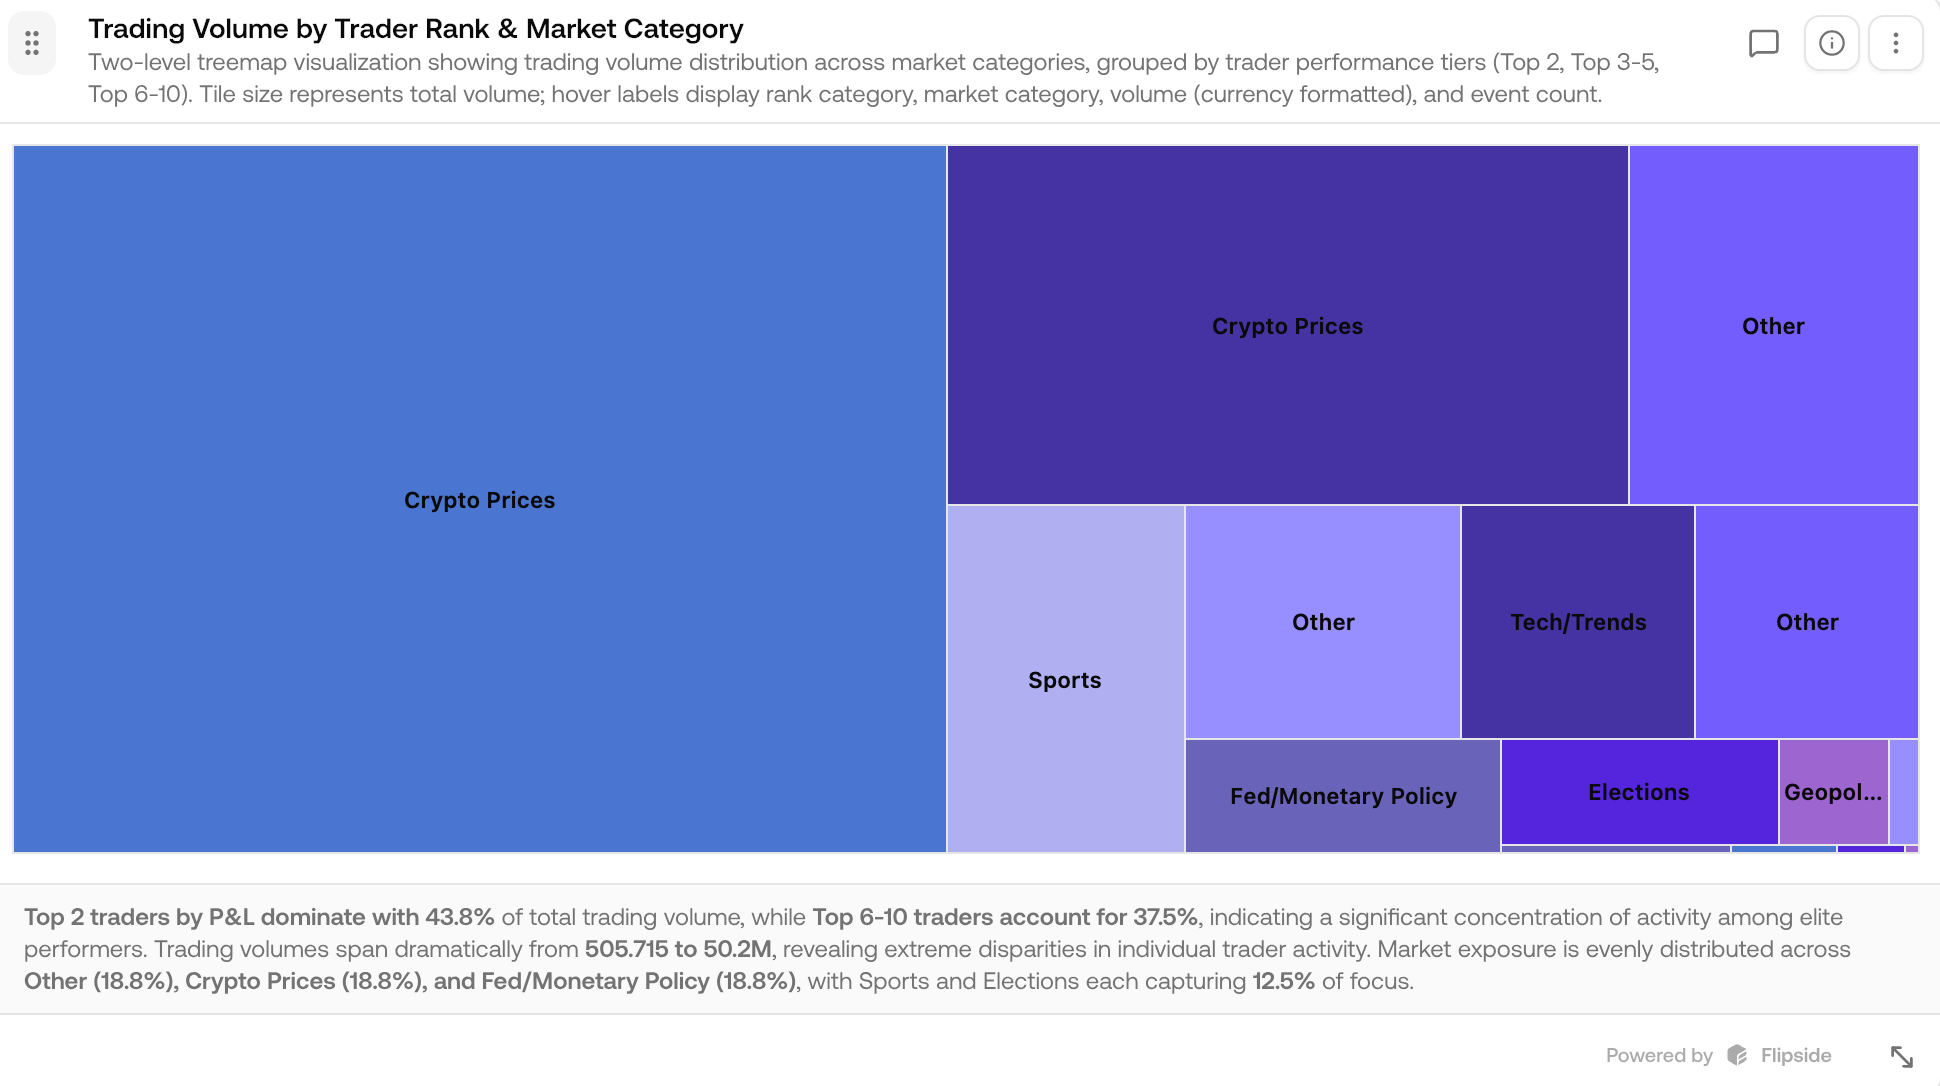
- A treemap breaks down market categories by trading volume and grouped by trader. Crypto prices betting leads with the top 2 traders by P&L both betting in the Crypto prices category and dominating with 43.8% trading volume, followed by Other and Sports. This shows concentration risks and preferences - the majority of the volumes from the top traders are from Crypto price betting in the past 90 days.
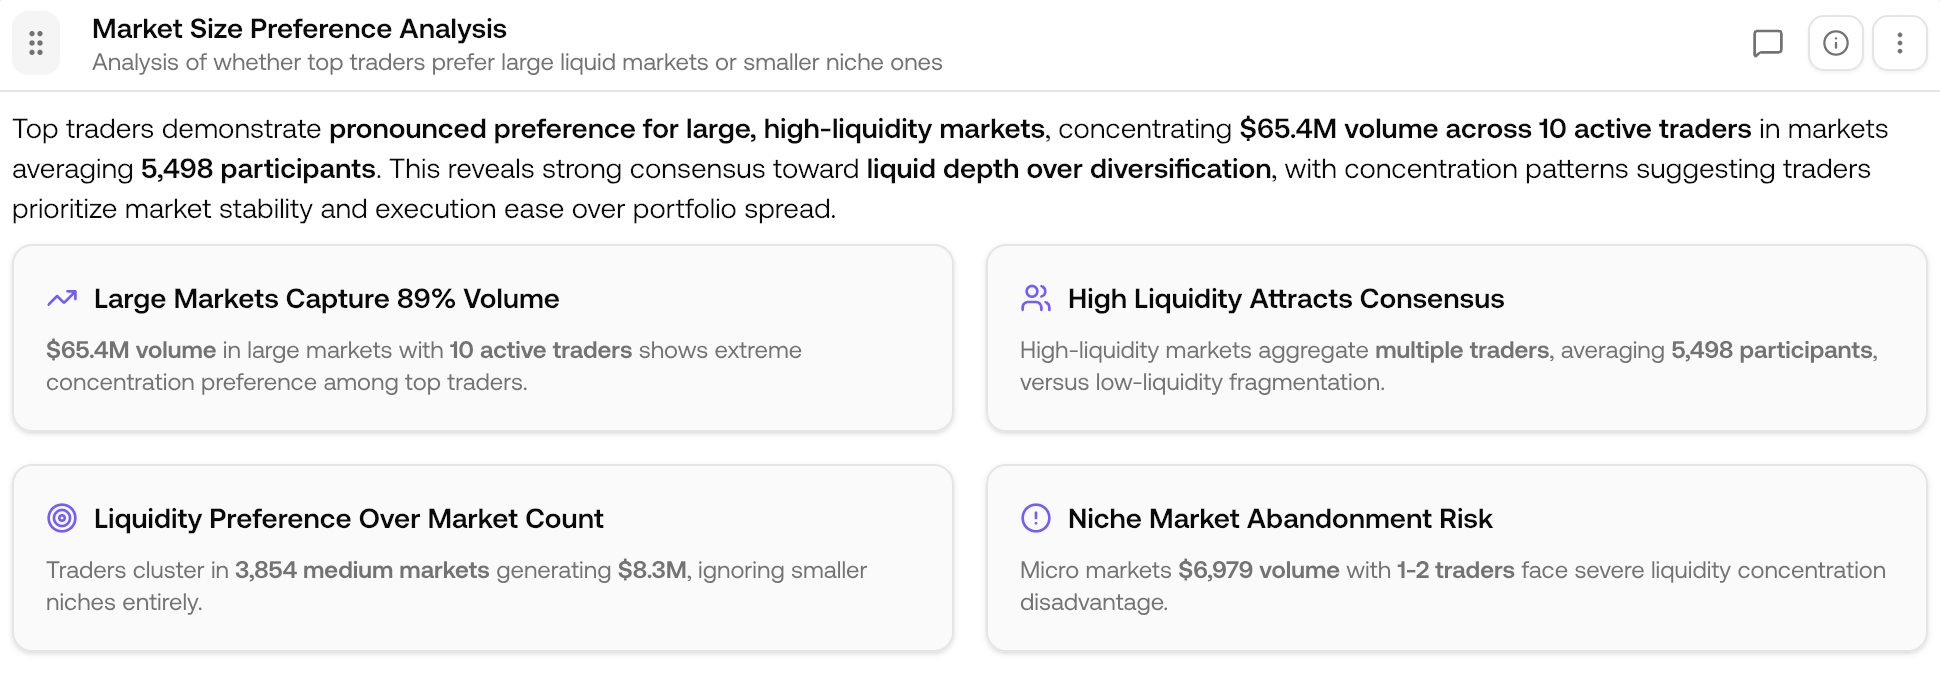
- A quick summary that provides an in-depth overview and analysis of the market size preference analysis, highlighting the fact that top traders pronounced preference for large, high-liquidity markets and further revealing the strong consensus towards liquid depth over diversifications from traders.
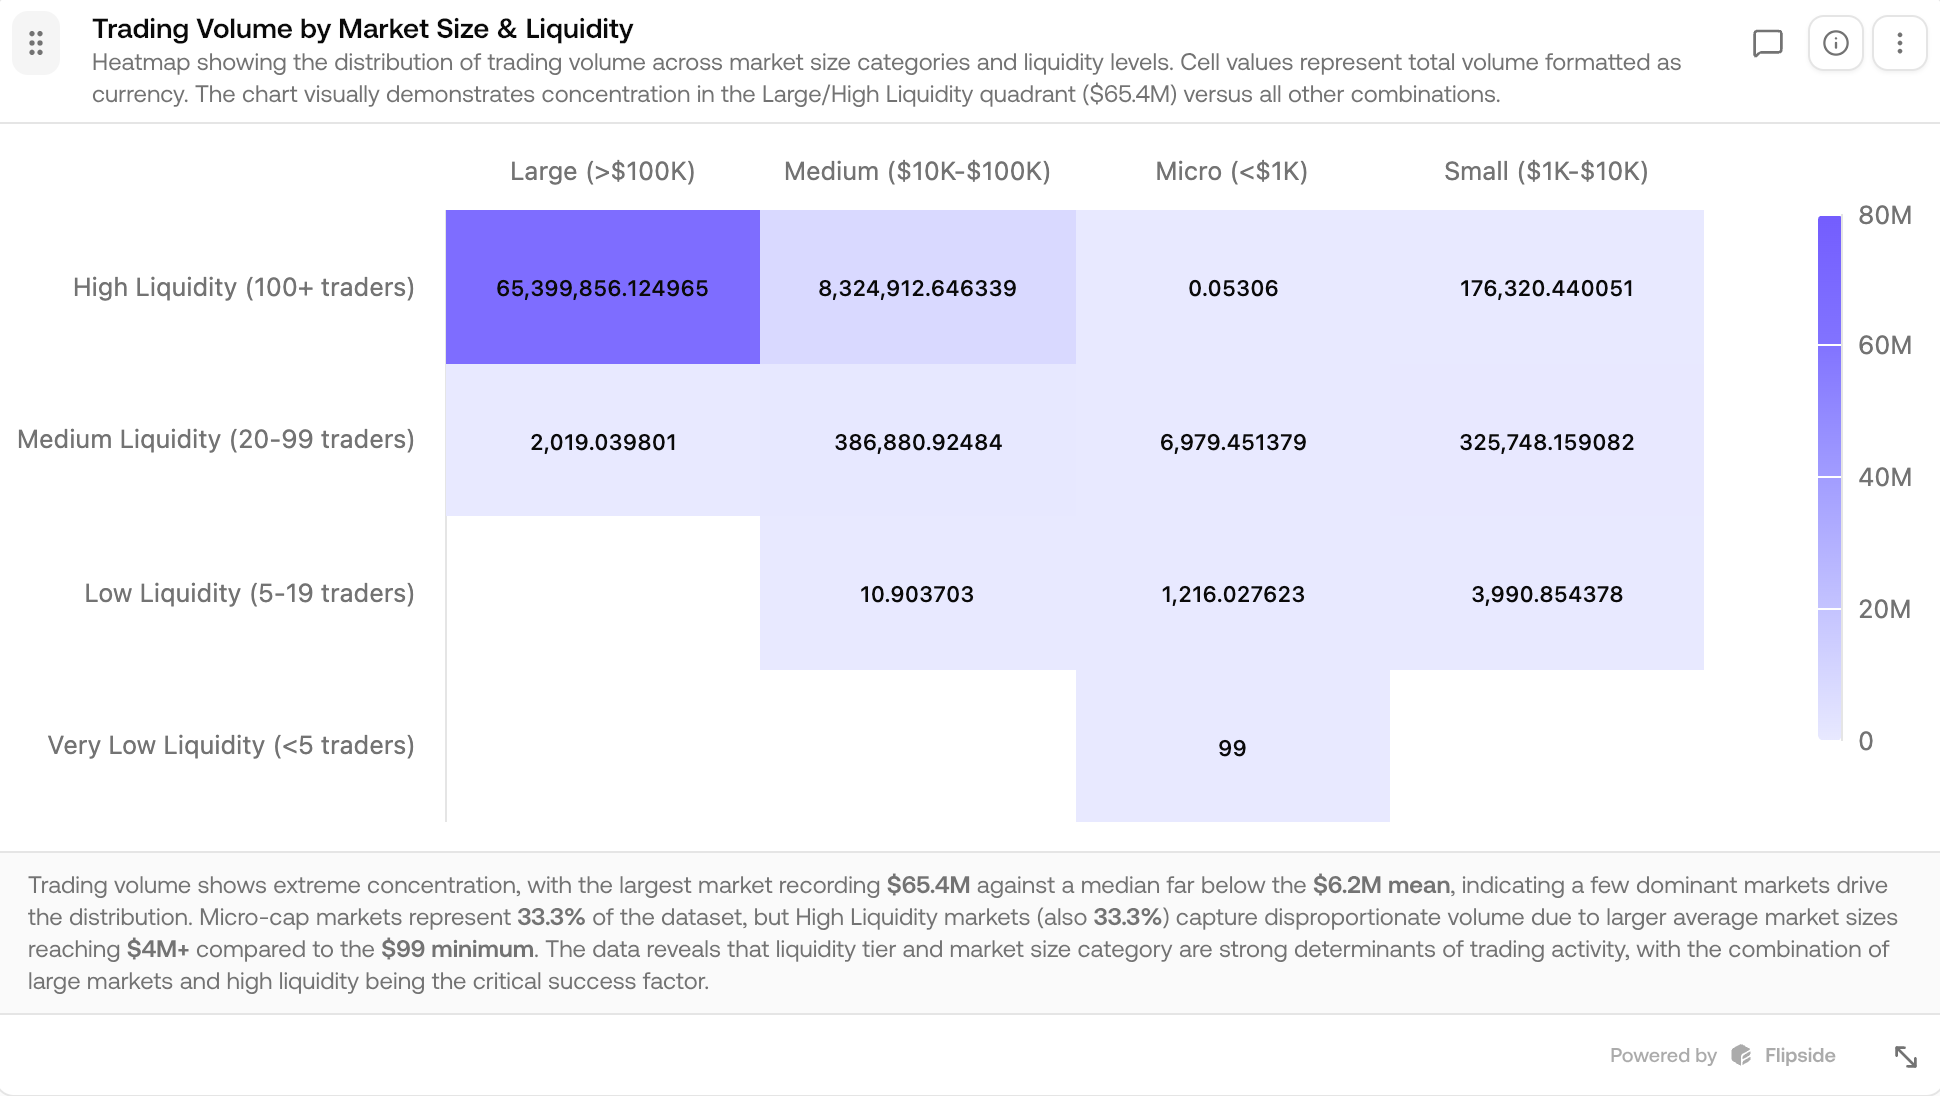
- A heat-map showing the distribution of trading volume across market size categories and liquidity levels, further demonstrating the concentration of top traders in large market size & high liquidity quadrant versus the micro/small market size and and low/very low liquidity quadrant.
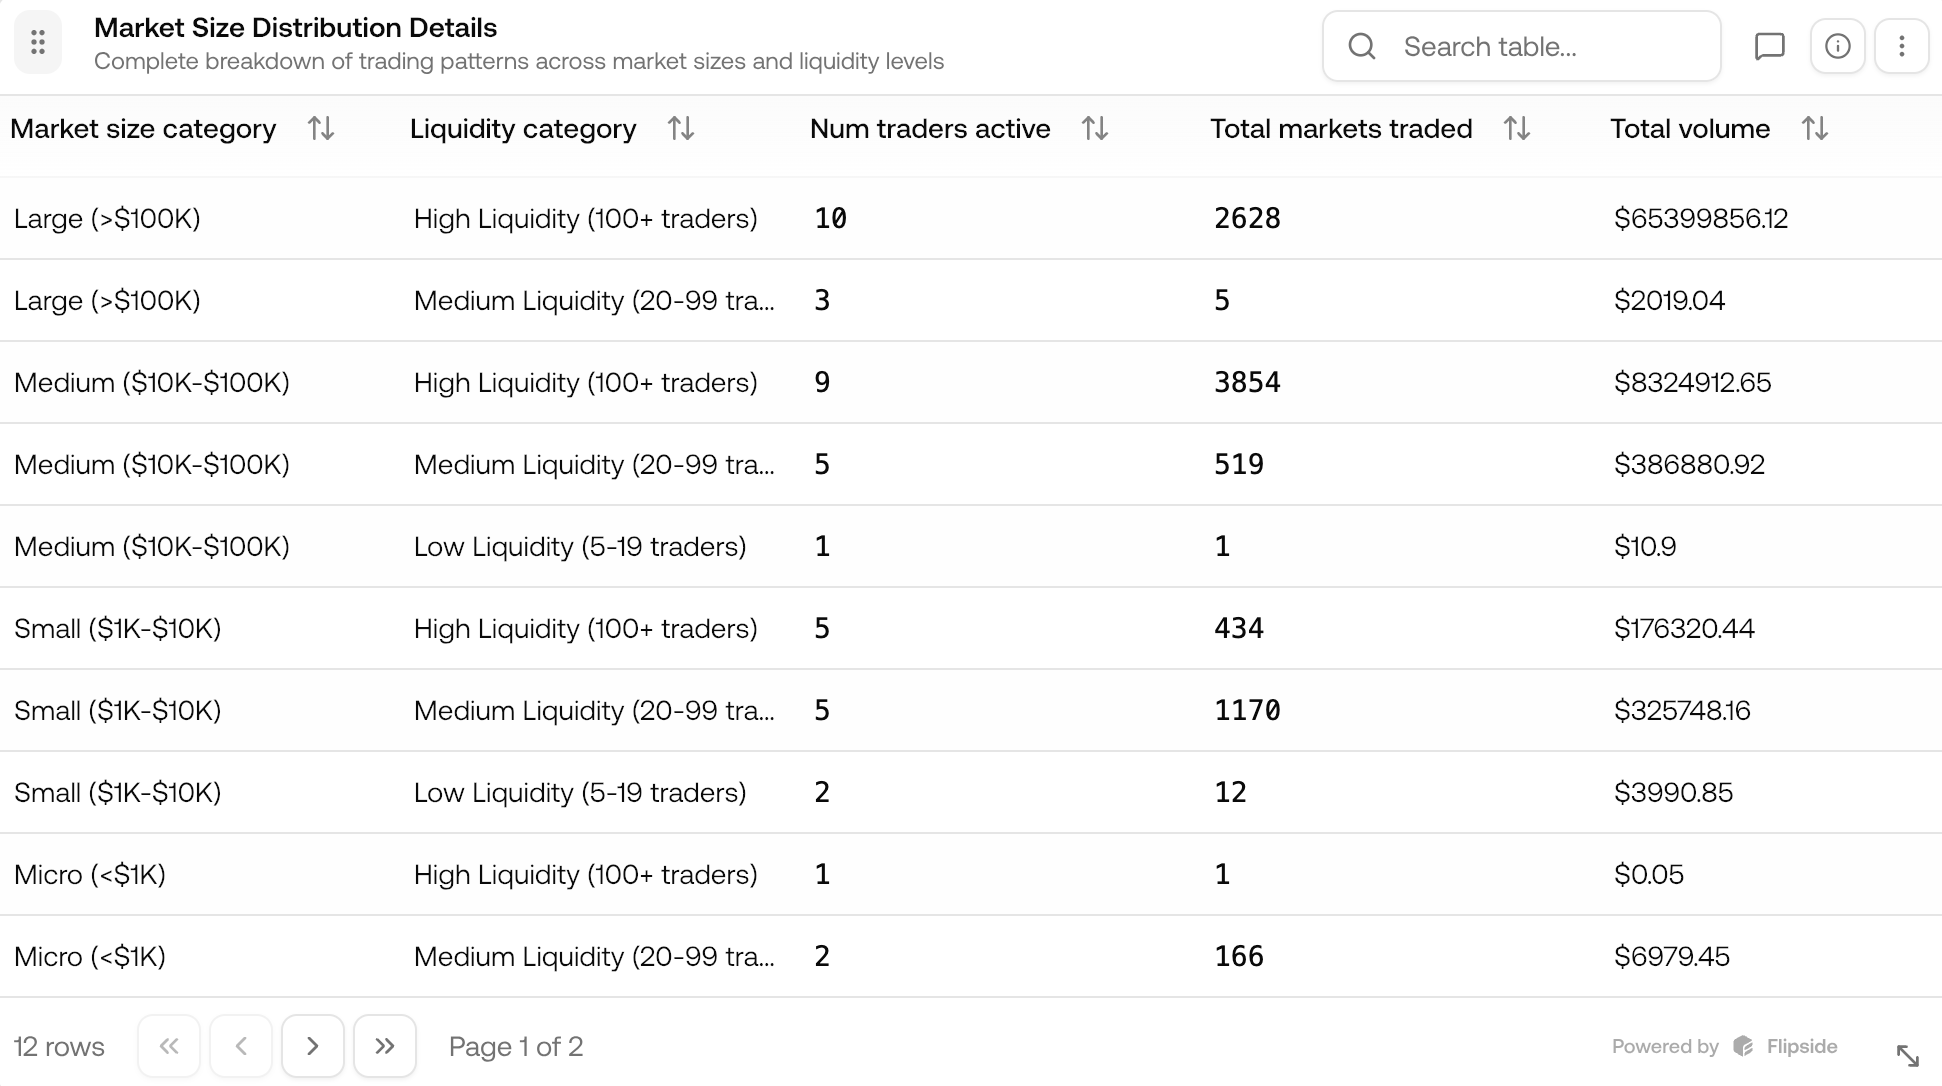
- Detailed table for traders market size distribution: Utilize these comprehensive data tables to conduct a thorough and granular examination of specific metrics and details, including but not limited to the total number of active traders participating in each category, the complete count of distinct markets that have been traded within each segment, as well as the aggregate trader volume denominated in USD that has been transacted across every possible combination and intersection of market size categories (ranging from micro to large) and liquidity level classifications (spanning from very low to high liquidity).
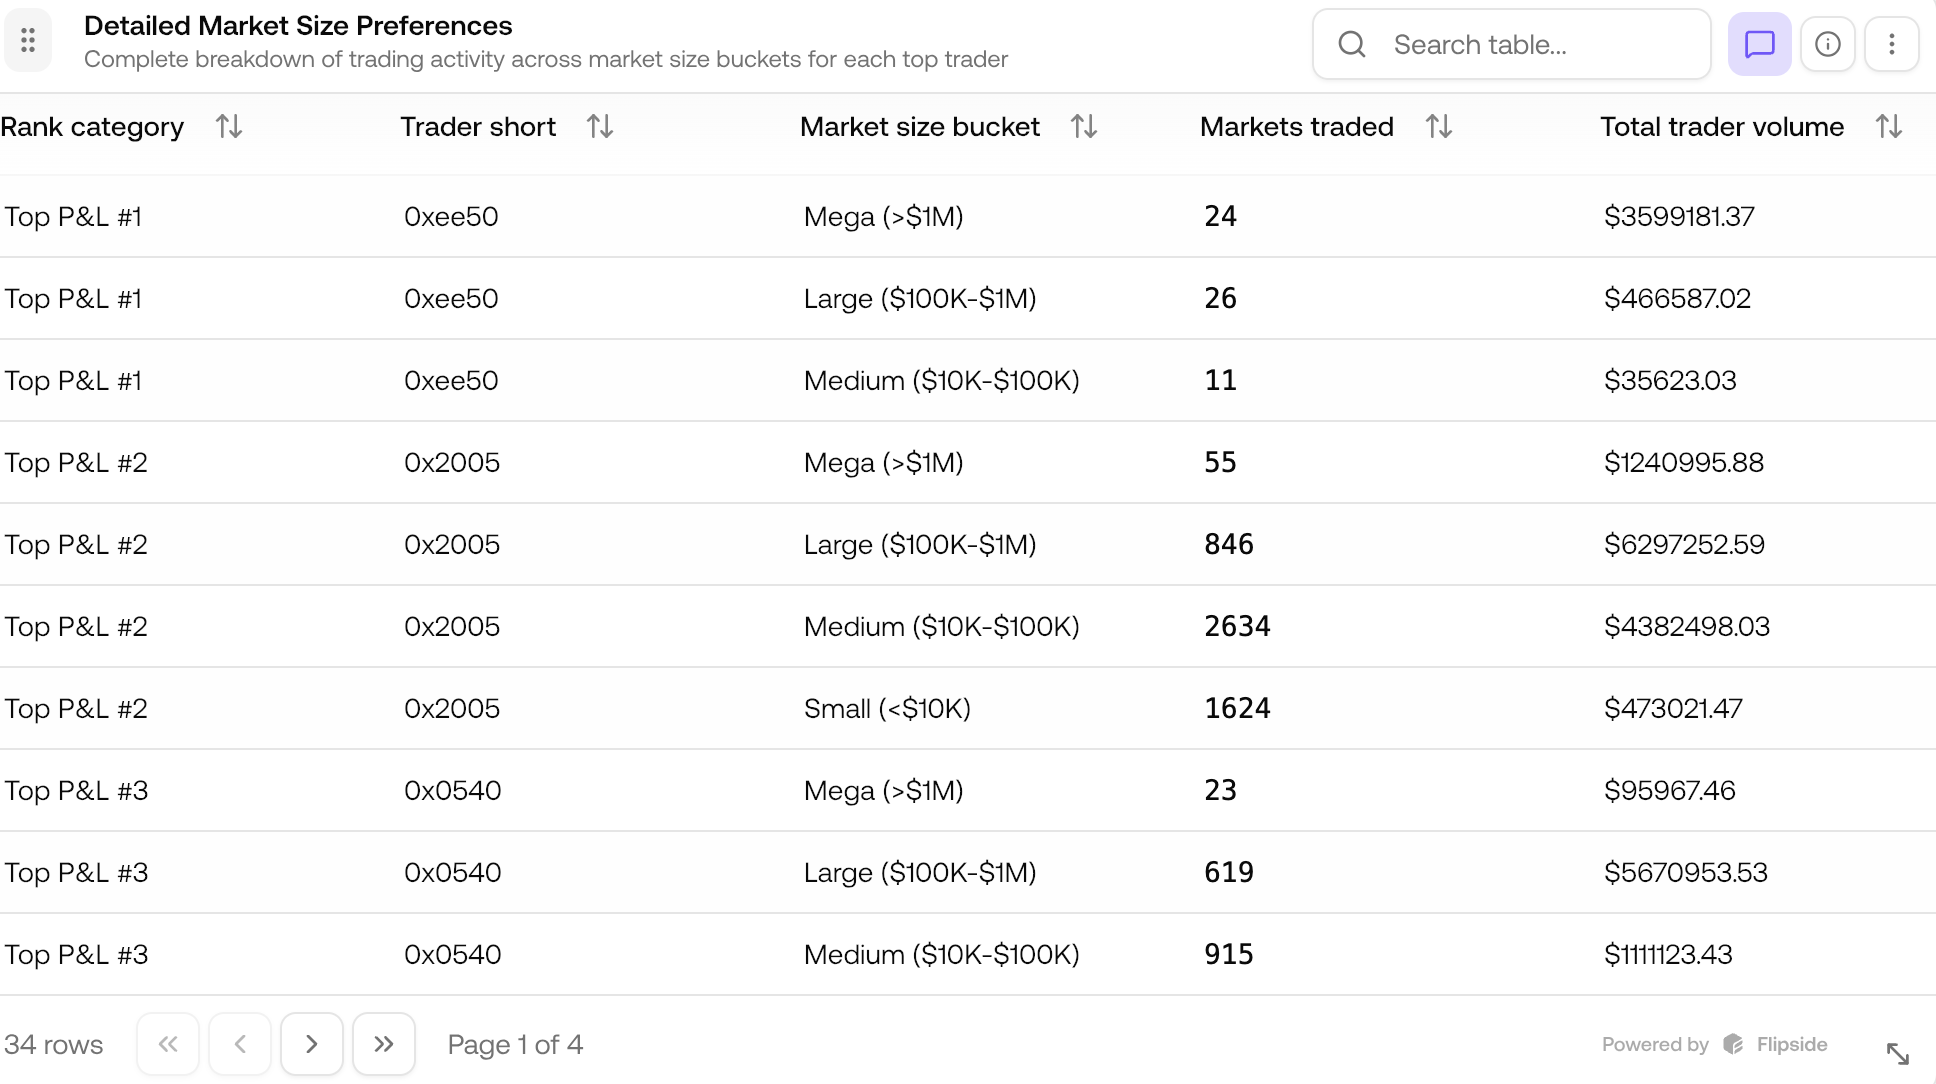
- Detailed tables for individual top traders market size preference: This comprehensive and detailed table provides an in-depth breakdown and analysis of each top trader’s strategic approach to market participation, specifically examining their preferred market size categories, their level of market diversification as measured by the total number of distinct markets they have actively traded in, as well as the aggregate trading volume they have committed across these various markets, enabling you to gain a thorough understanding of the nuanced ways in which top-performing traders strategically balance and optimize the trade-offs between selecting appropriate market sizes, maintaining diversified exposure across multiple different markets, and deploying their capital volume effectively.
Crosschain and Strategy Insights
Now given these top traders activities insights on Polymarket on Polygon, it’s also interesting to dig deeper to see if these traders also trade on other chains and protocols. Since the addresses are shared across ETH mainnet and all the ETH L2 chains and Flipside has the crosschain data for these other chains, it makes it easy to ask the AI to cross check whether these top traders also trade on other ETH L2 chains and protocols.
Prompt:
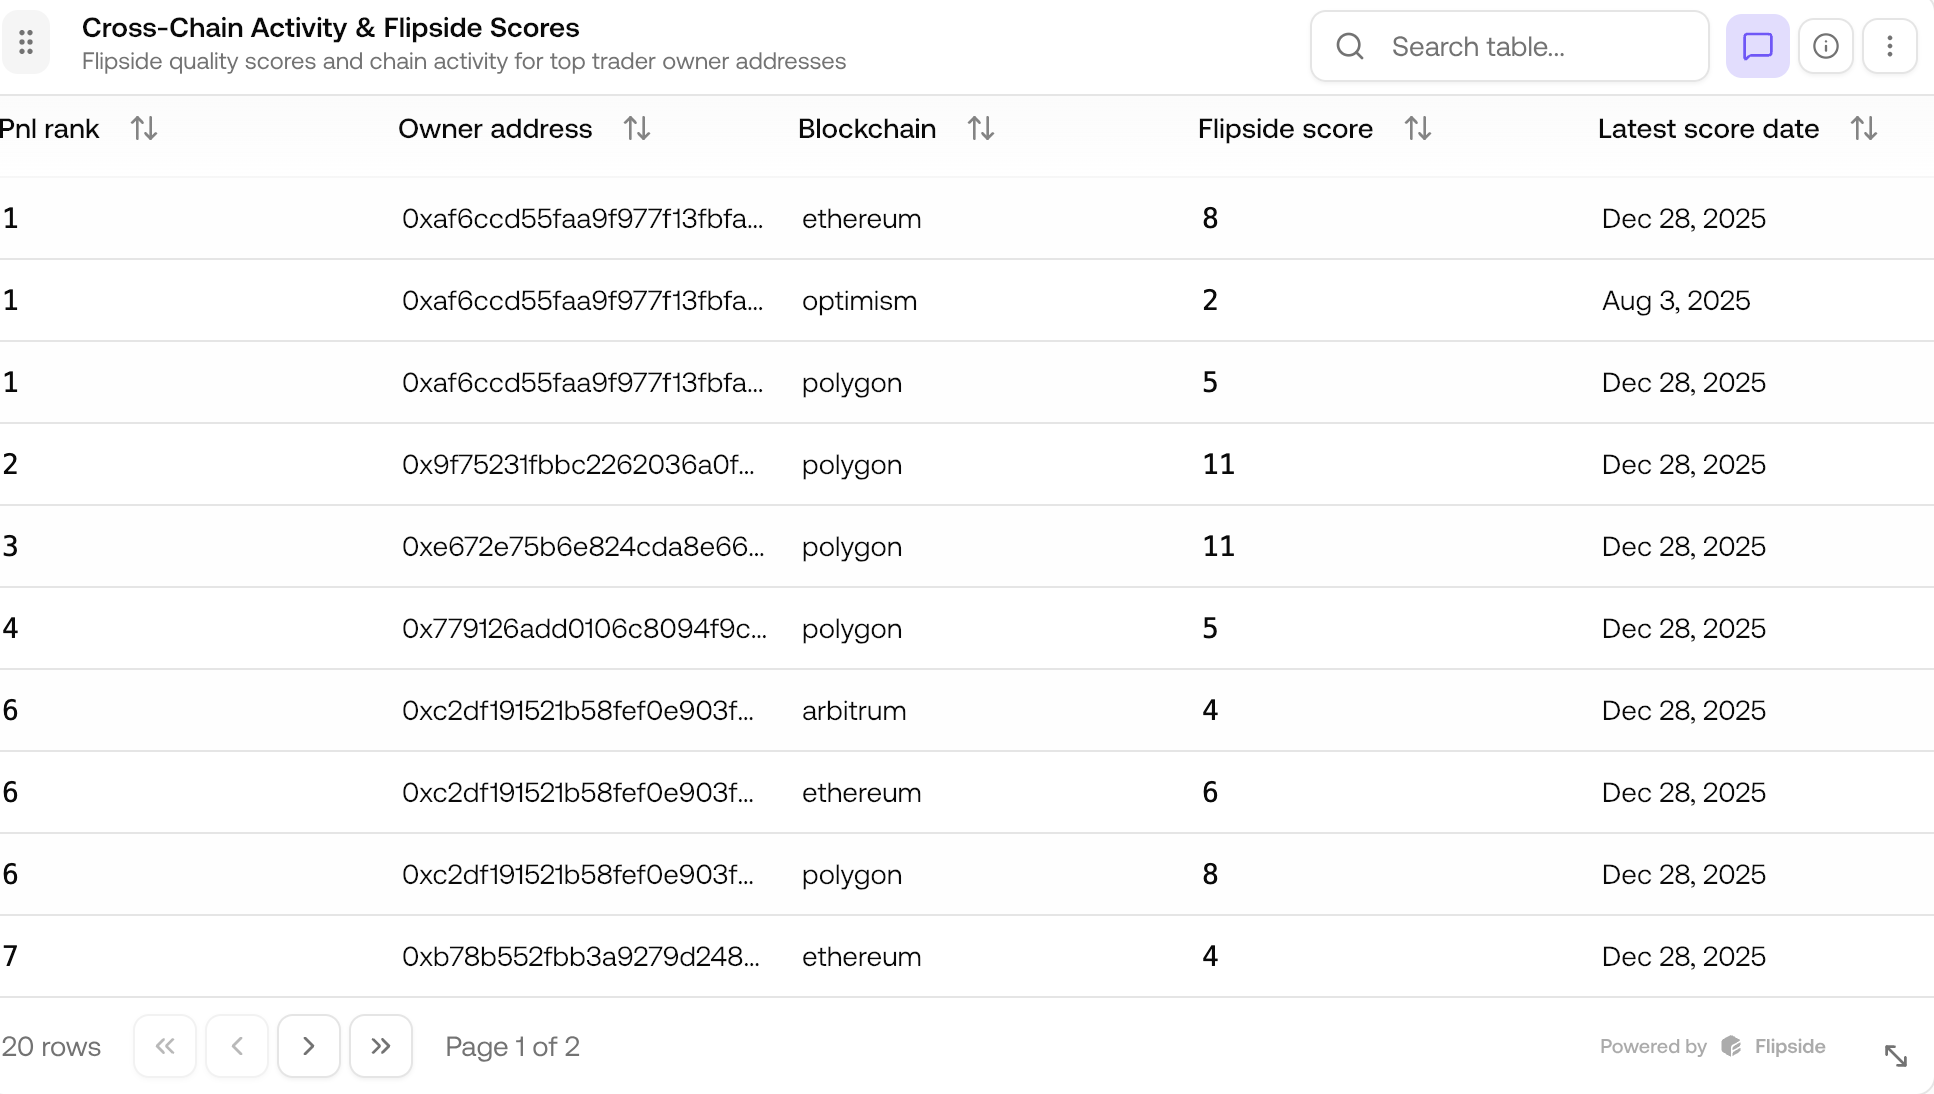
Can you take the top traders addresses and look into these addresses activities on other ETH or ETH L2 chains and their corresponding Flipside score for those chains with activities?
These top traders show crosschain activity beyond Polymarket on Ethereum, Arbitrum, and Optimism, though Polygon remains their dominant ecosystem. Their Flipside Scores indicate sustained crosschain engagement over time. This reveals an interesting insight: most top traders in this analysis are likely crypto natives focused on Crypto Prices betting, as the market categorization charts above confirm.

Deep Dive: Analyzing a Specific Trader’s Moves
Once you’ve identified a whale, FlipsideAI lets you zoom in. Take the French trader known as Theo4, who reportedly netted around $48 million (some estimates say up to $79 million) by betting heavily on Donald Trump’s 2024 election win. Operating multiple accounts like Theo4 (wallet: 0x56685839…), Fredi9999, PrincessCaro, and Michie, he wagered on Trump securing the Electoral College and popular vote, turning unrealized losses into massive gains post-election (see details on Business Insider news).
Asking FlipsideAI with the prompt below specifically about the French trader Theo4, you’ll get a tailored dashboard for this whale. It covers everything from trade history to position sizes, helping you unpack their strategy.
Prompt:
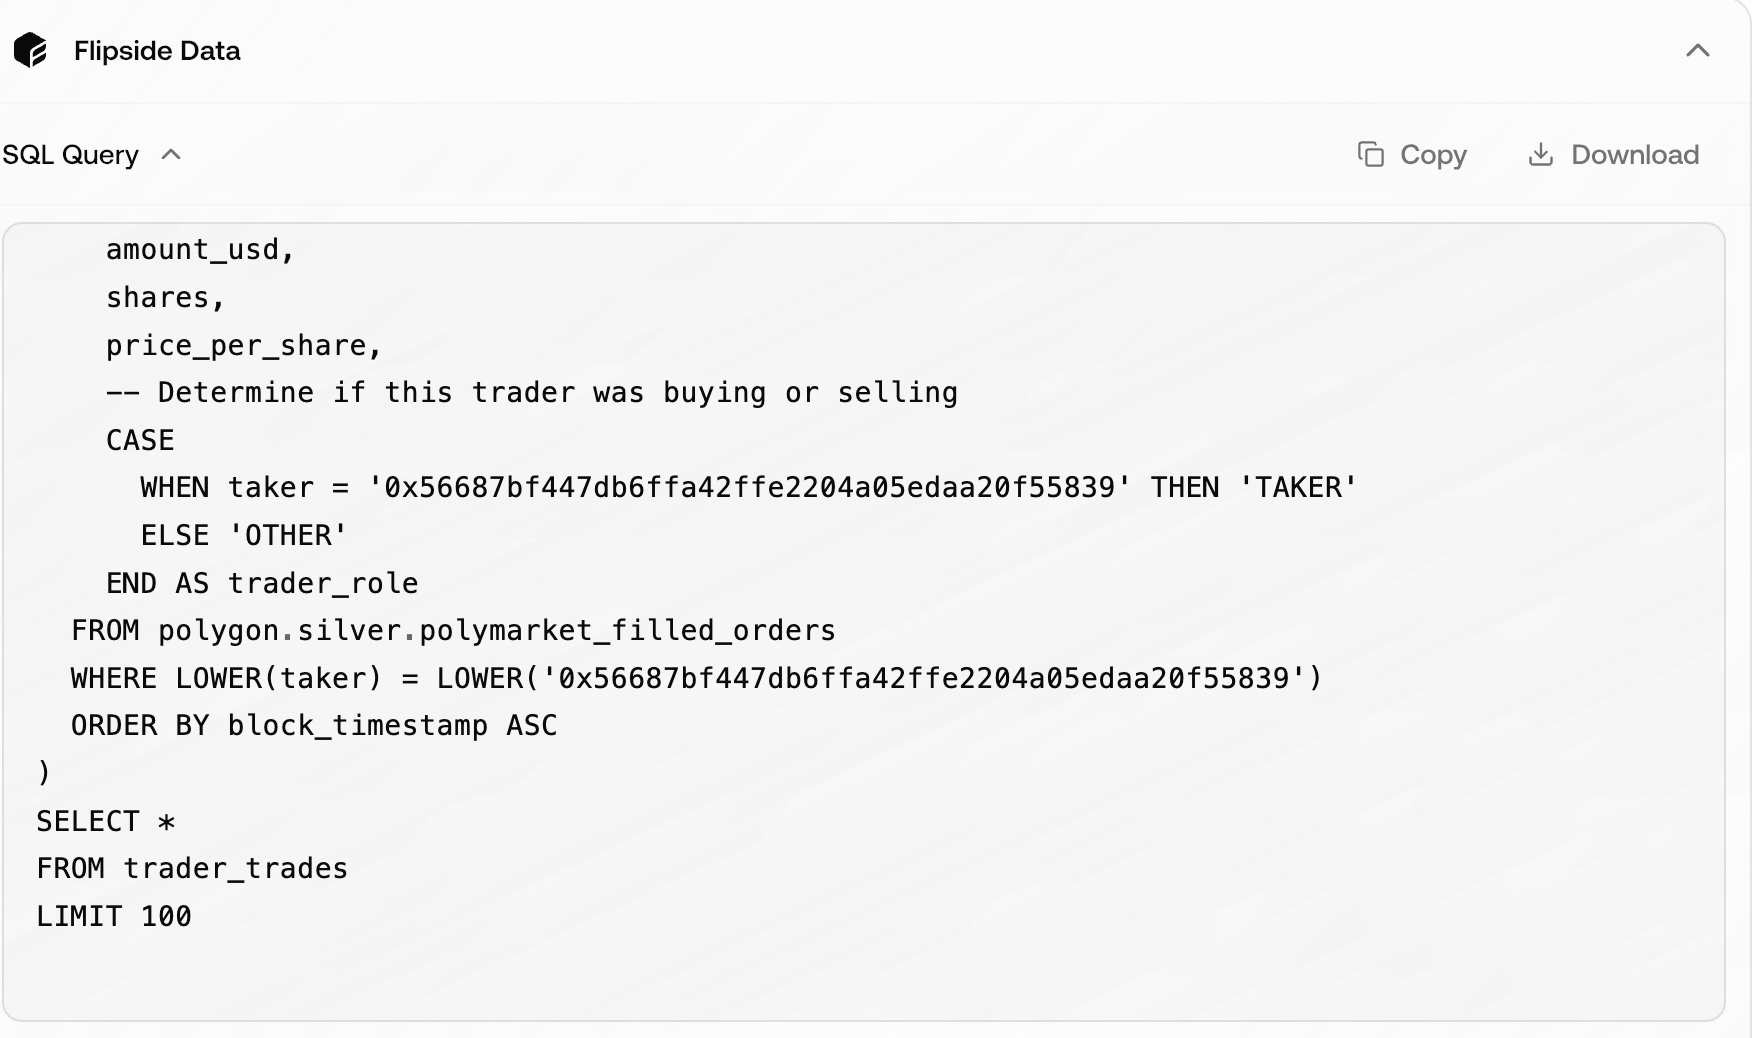
Can you analyse the historical trade activities of this trader 0x56687bf447db6ffa42ffe2204a05edaa20f55839 on Polymarket?
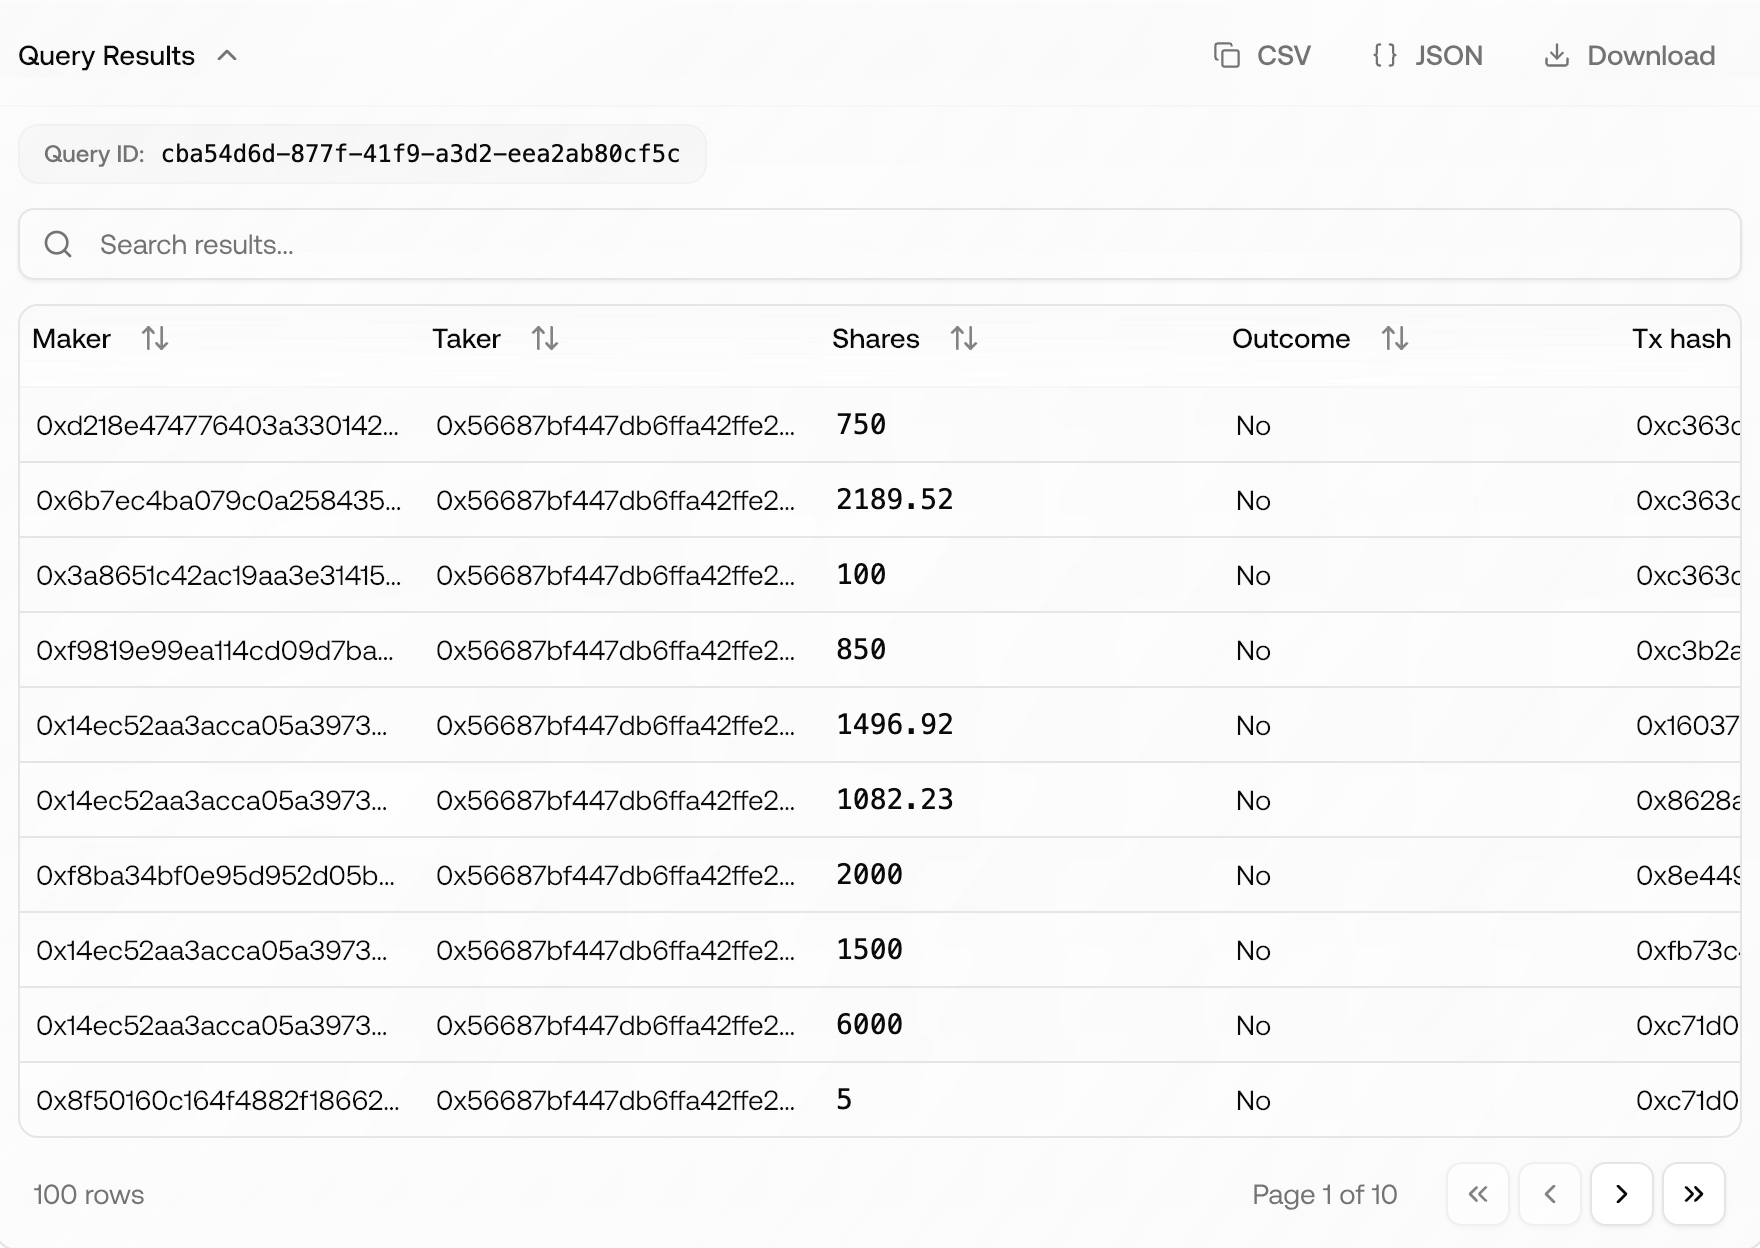
FlipsideAI starts with the query to get the historical trade activities of this trader (0x56687bf447db6ffa42ffe2204a05edaa20f55839) on Polymarket.
It then dives deep into analysing the market participation and outcome preferences of this trader, covering trading volume, market participation, outcome preferences, and temporal patterns over 30 days.
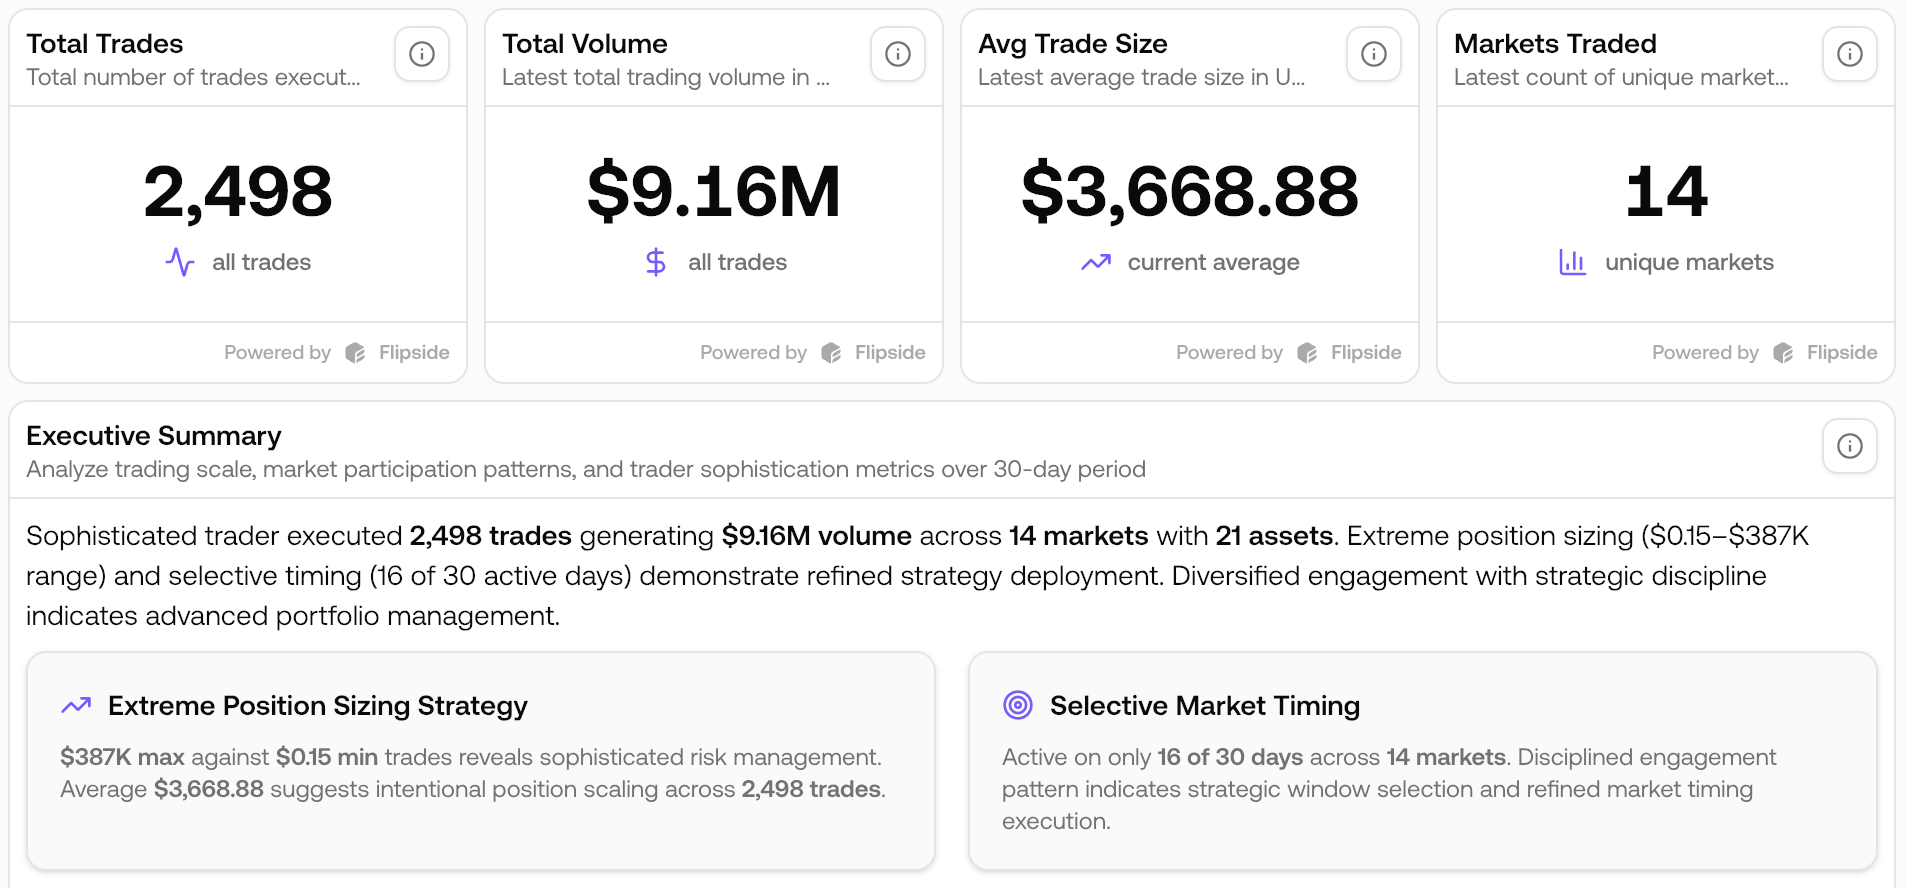
FlipsideAI presents an executive summary at the top, showing total trades executed, total volume, average trade size, and number of markets traded, providing a clear snapshot of this trader’s strategy.
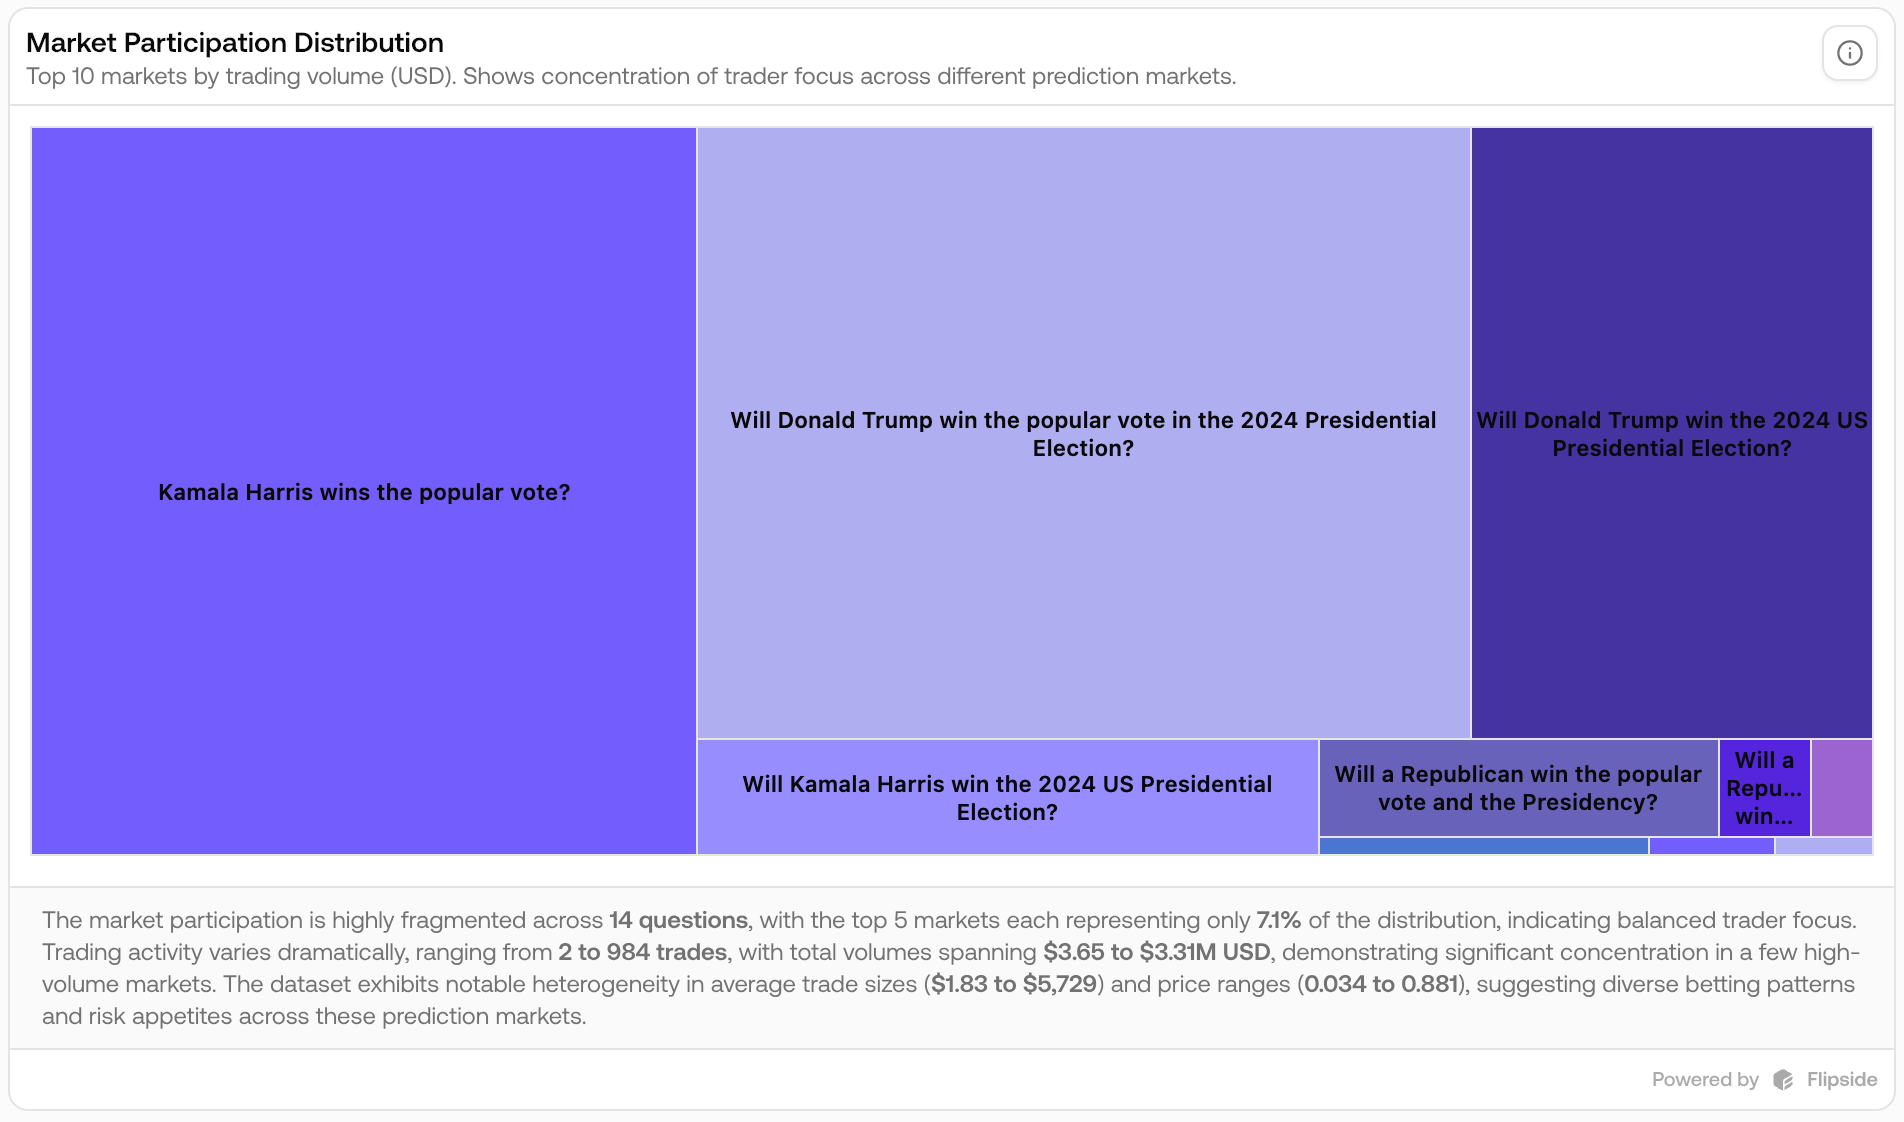
As shown in the tree-map below, the top 10 prediction markets by trading volume from this trader are all in the U.S. Elections category, focusing on the same event — the 2024 presidential election— with different question formats. Essentially, this trader placed the same bet on the same political event across multiple duplicate markets, taking advantage of how Polymarket frames questions for the same event.
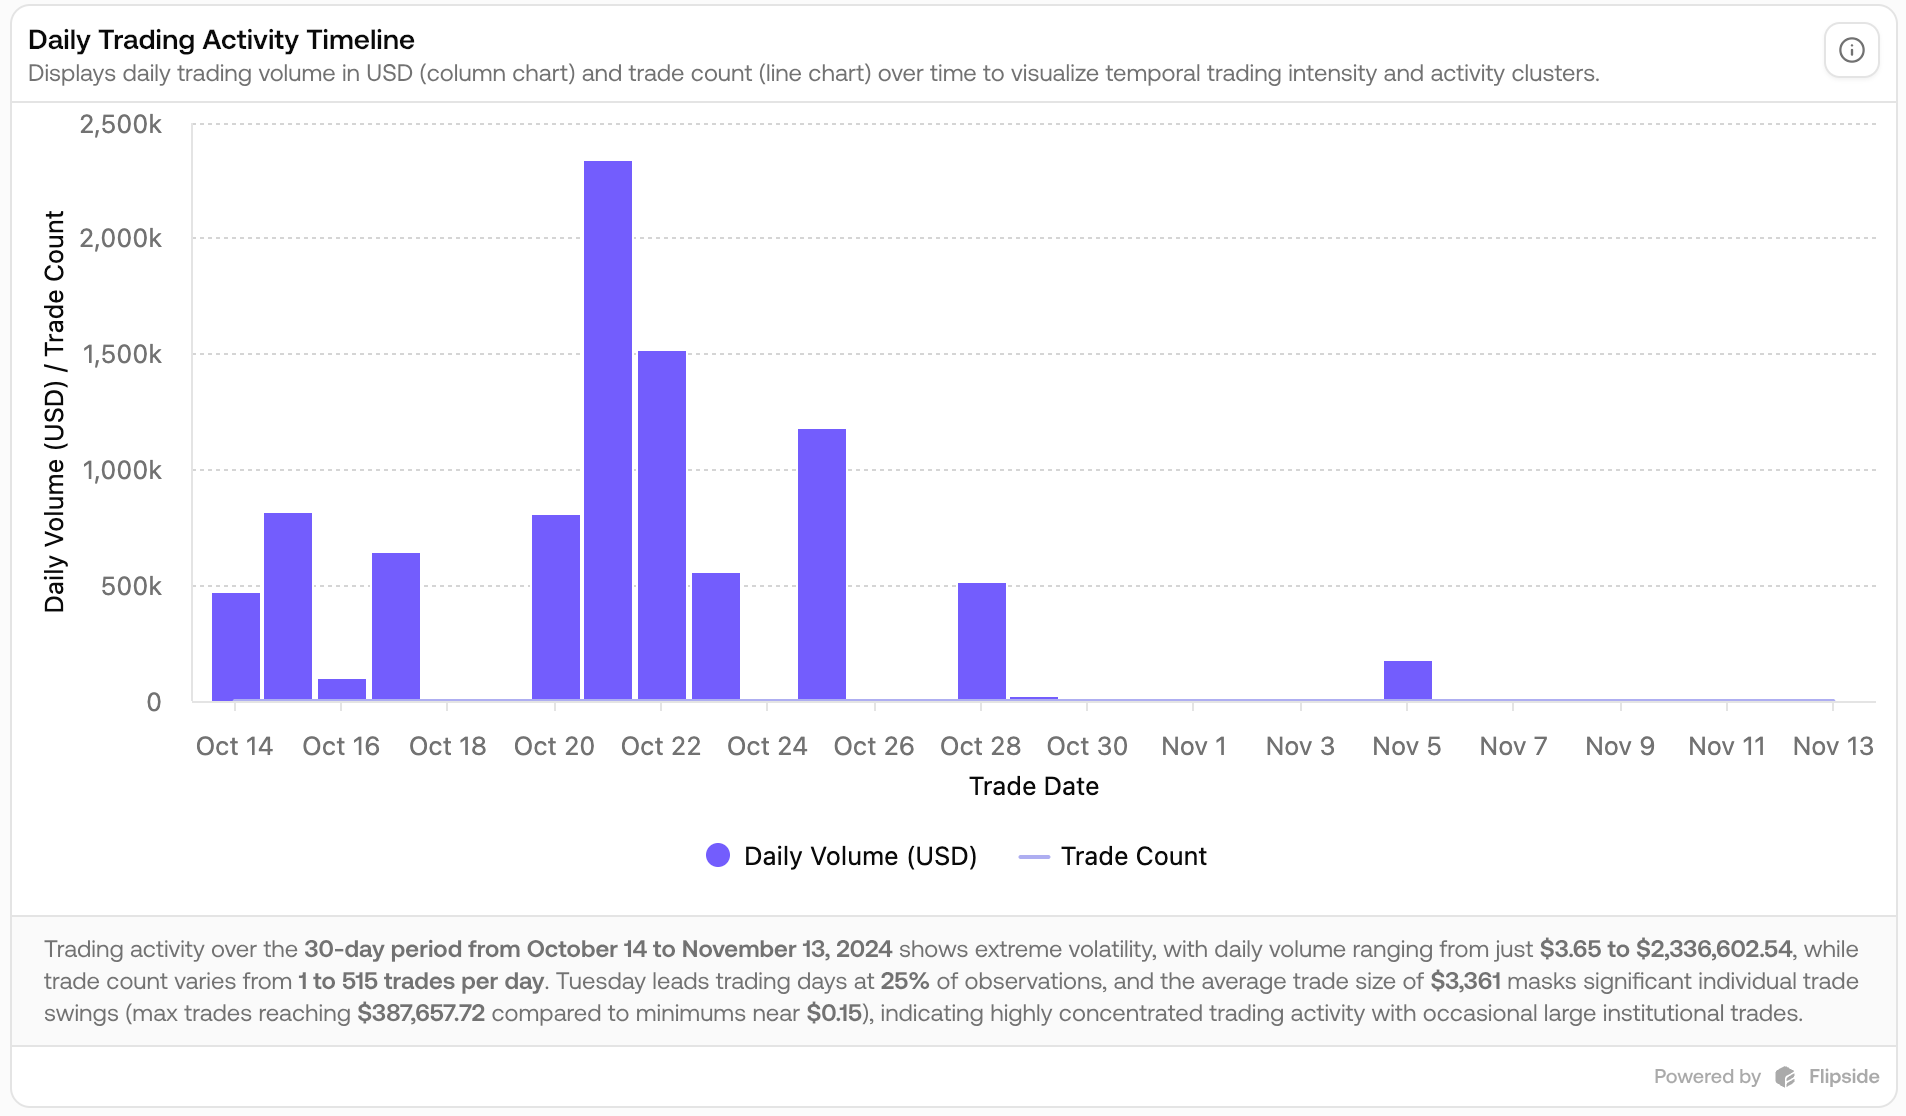
The trading activities across the timeline also aligns with the time when the U.S. 2024 election timeline, with daily volumes peaking during the days from October 20 to 23, 2024.
Analyzing wallet Theo4 (0x5668..) on Polymarket with FlipsideAI quickly reveals the trader’s highly concentrated strategy. The analysis provides comprehensive metrics including total trades, volume, average trade size, and concentrated market participation. It demonstrates how FlipsideAI enables deep investigation of specific whale strategies using simple natural language, no queries required.
From Curiosity to Strategy
FlipsideAI turns Polymarket from a black box into an open research environment.
With natural language queries, users can:
- Discover top traders without knowing addresses
- Validate media narratives with onchain data
- Learn from real trading behavior, not speculation
- Track whales, strategies, and market flows on Polygon
No SQL. No dashboards built from scratch. Just questions and answers.
Start Exploring Polymarket with Flipspace
Whether you’re:
- A trader looking for signal
- A researcher studying prediction markets
- Or simply curious who’s winning on Polymarket
Flipspace gives you the tools to see what the smartest wallets are actually doing.